
2021 Portfolio Performance and 2022 Strategy
2021 Portfolio Performance and 2022 Strategy
2021 in rewind and 2022 strategic positioning

2021 was a volatile year as growth stocks seemed to trade separately from the major indices and at times, became very bubble-like. On the other side of the bubbles came two big *pops*, one in February and one in October/November. In both cases, many growth stock investor portfolio’s never returned back to the all time highs. Investing in growth isn’t easy due to how quick the stock can become detached from its fundamentals on the upside and downside. It’s easy to become a momentum trader rather than a growth stock investor. However, if you did under perform the market as a growth stock investor it wasn’t necessarily your fault. The 2021 market was historic in the sense of the amount excess liquidity fueled by the Fed’s asset purchases of $120B a month.
This meant that stock prices can quickly become detached and that pre-revenue companies, crypto, and speculation can run wild. Everybody has money. Rivian, Lucid, Doge Coin, pre-revenue SPAC’s, or companies trading at 100x P/S, this is all fueled by the Fed’s asset purchases.
The key to this game is rooted in focusing on buying the best companies for the best price, then having the patience to let the investment grow. However, that’s not the way most investors want to manage this investing style. It becomes noisy and emotional as stock prices move faster than the sentiment that drives them. There are many technical factors that drive movement as traders pile into growth stocks. Unfortunately, the by-product is typically volatile swings in stock price.
I don’t expect 2022 to be as volatile as 2020 and 2021 was, which could be a good thing. Much of this has to do with contracting liquidity as it will zap a lot of the speculation out of the markets and leave investors and professional traders to benefit from the worlds greatest wealth machine. The purpose of this publication is to talk briefly about the year we just had and what we’re likely to experience over the next few months. In addition, I will share my portfolio and my strategy for 2022, exclusively for members. I will also talk about a few stocks I would like to own that I currently don’t and what I plan on doing to manage a tightening cycle at the Fed.
Here’s the format for today:
2021 in rewind
2022 expectations and potential
My portfolio, YTD performance and Strategy for 2022

2021 in Rewind
I don’t want to spend too much time here because many of us just lived through it. However, there were a few different charts in particular that are important to put the correct context on the year that we just had. In particular, centered around the bifurcation we saw between index performance vs the actual market’s performance. To draw comparison by how this market has performed YTD, we have to look back at pretty volatile times.
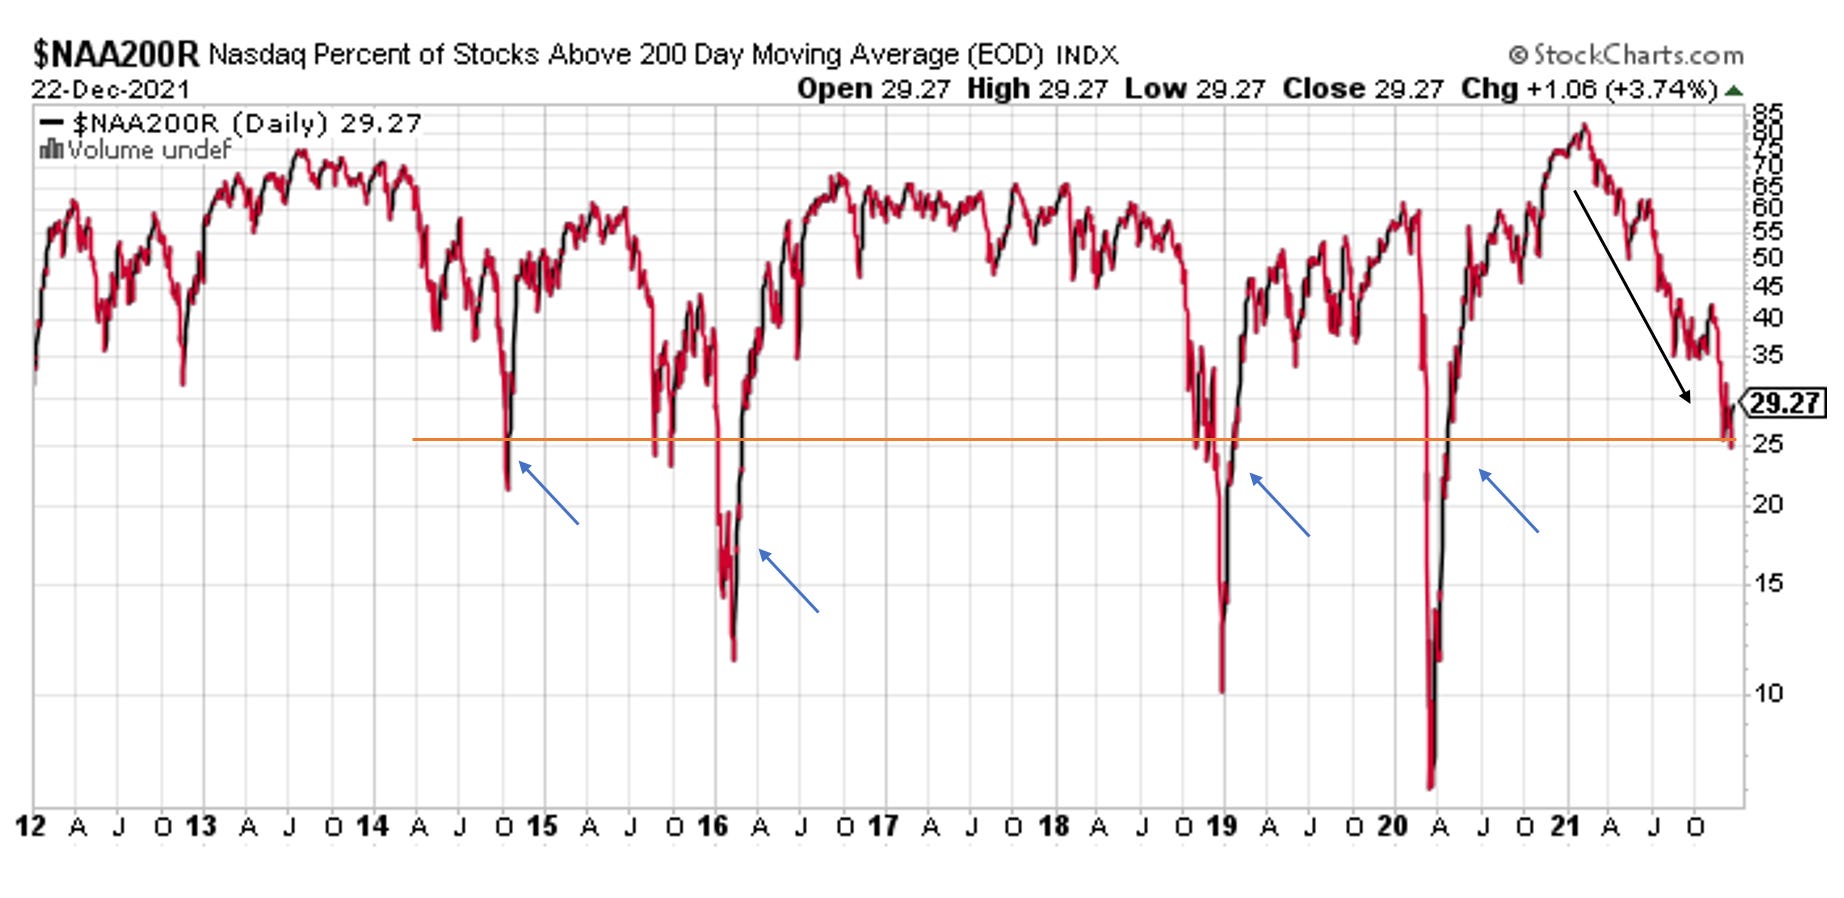
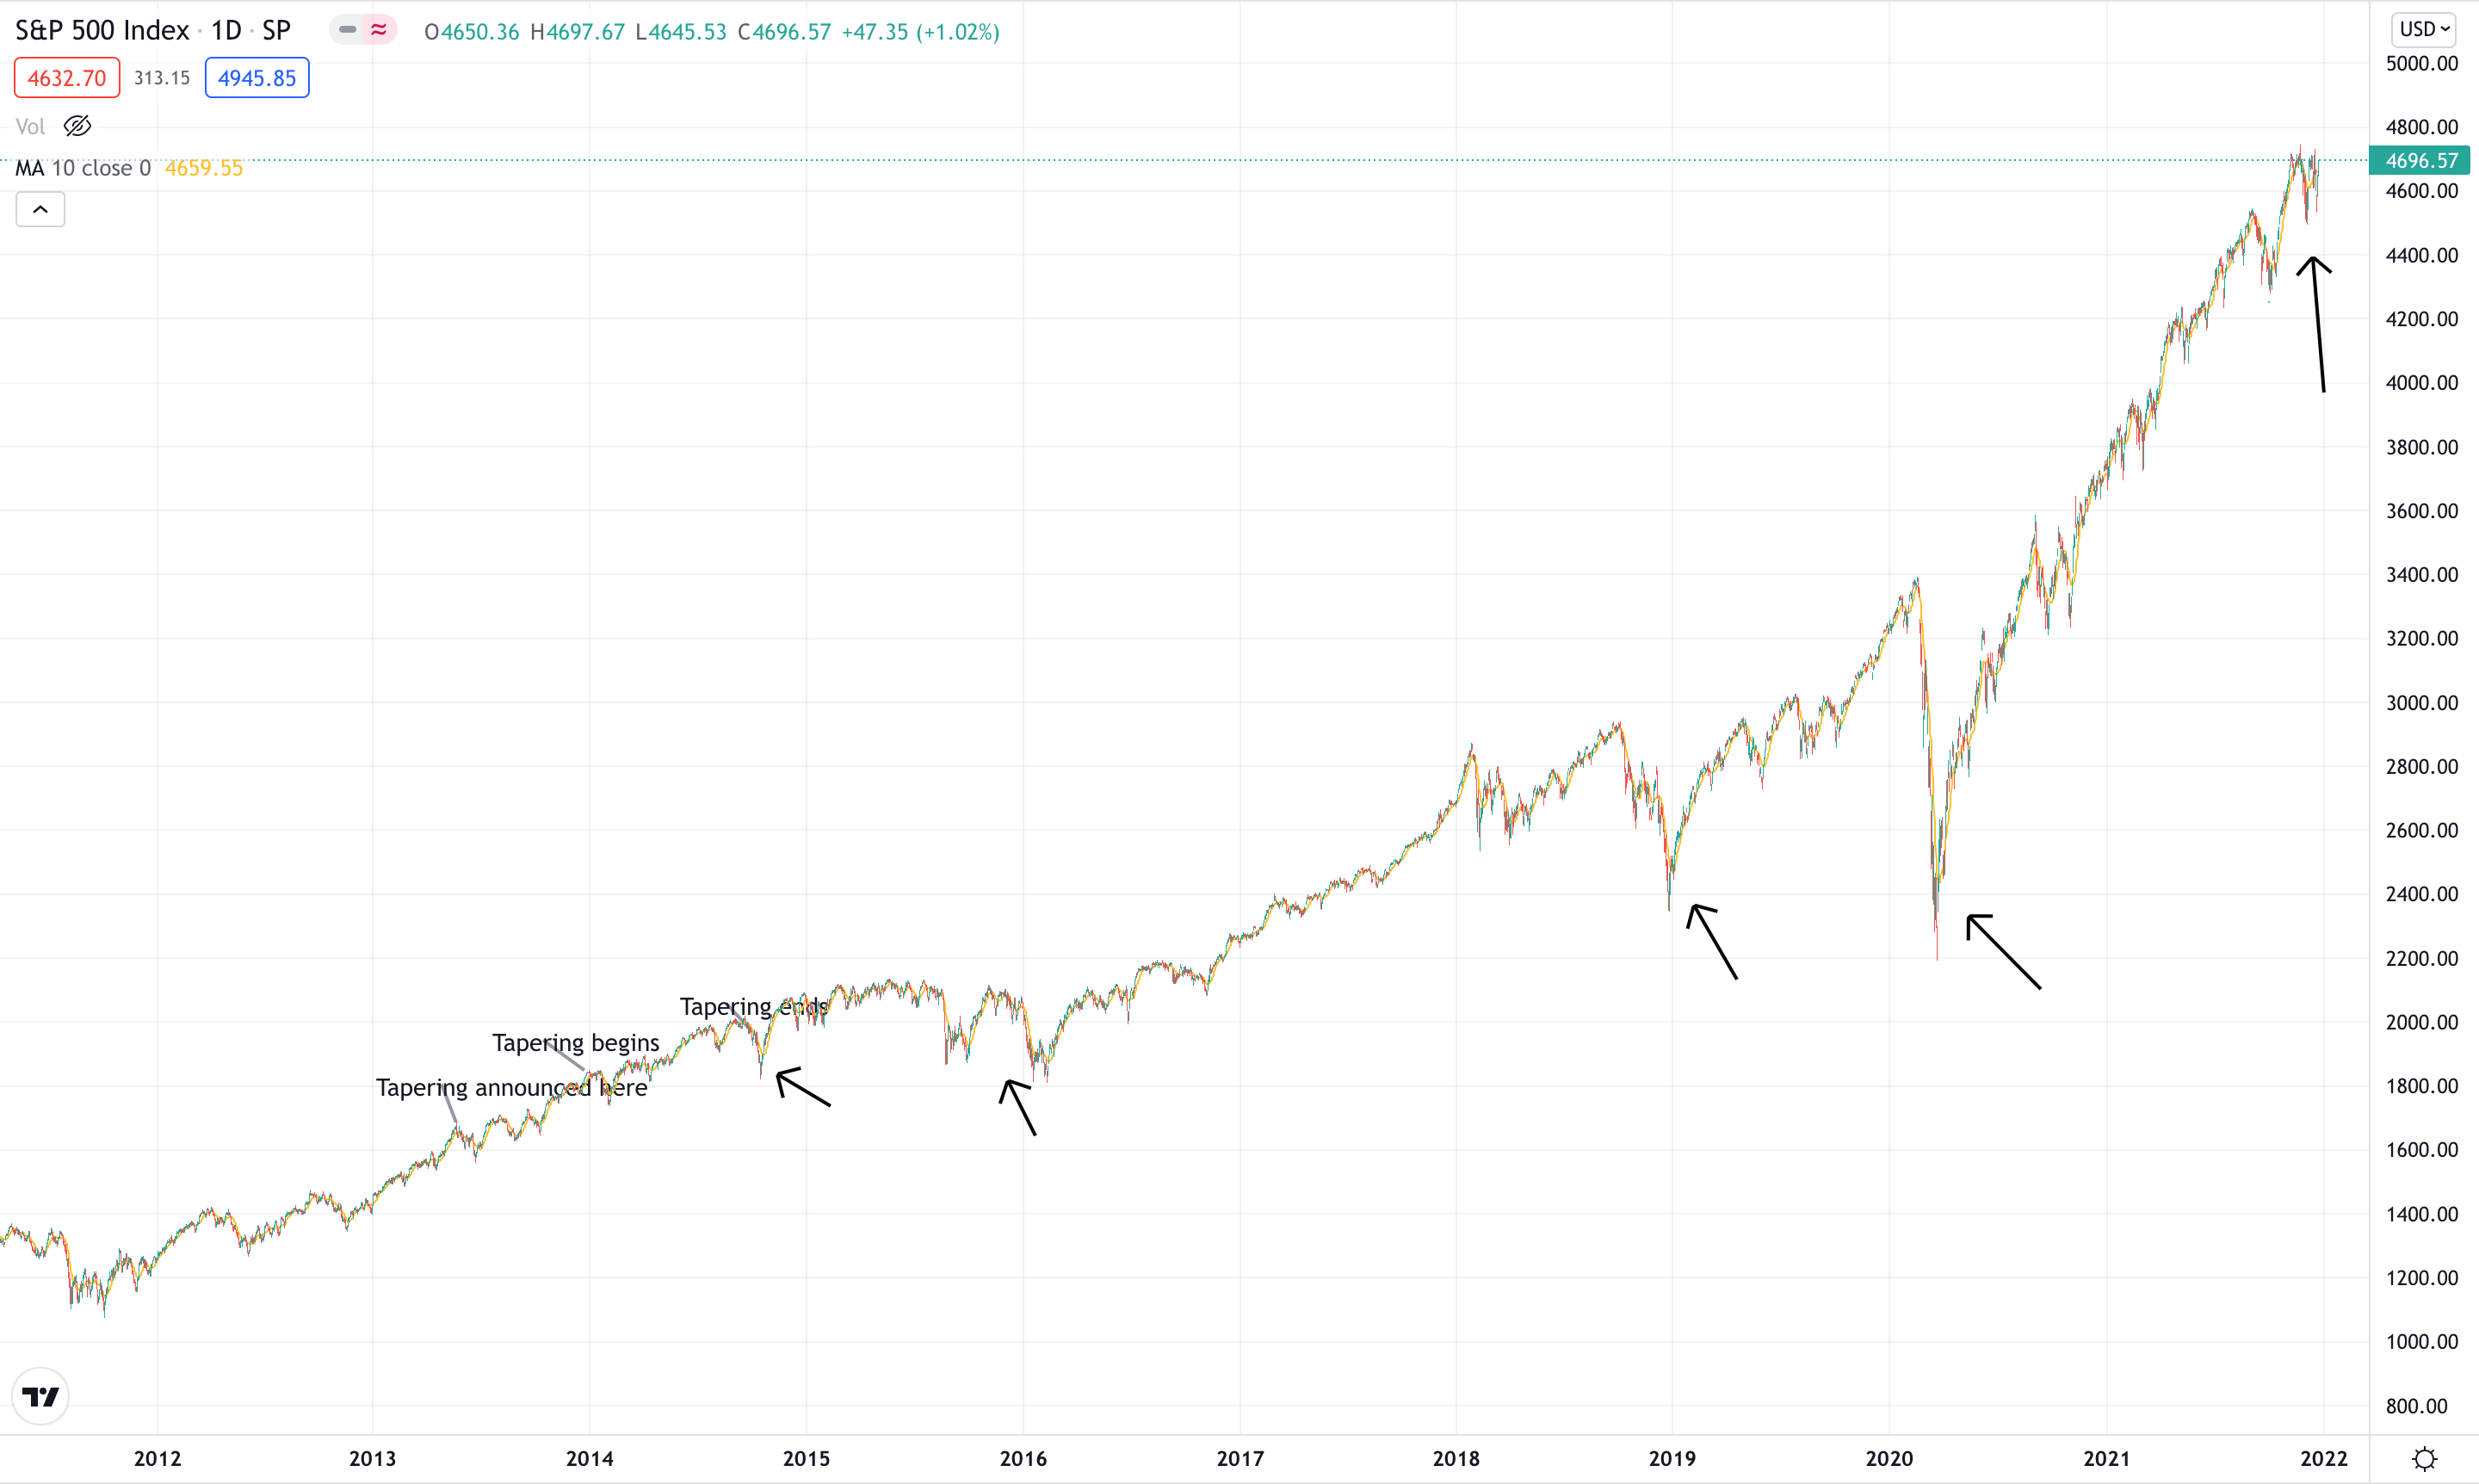
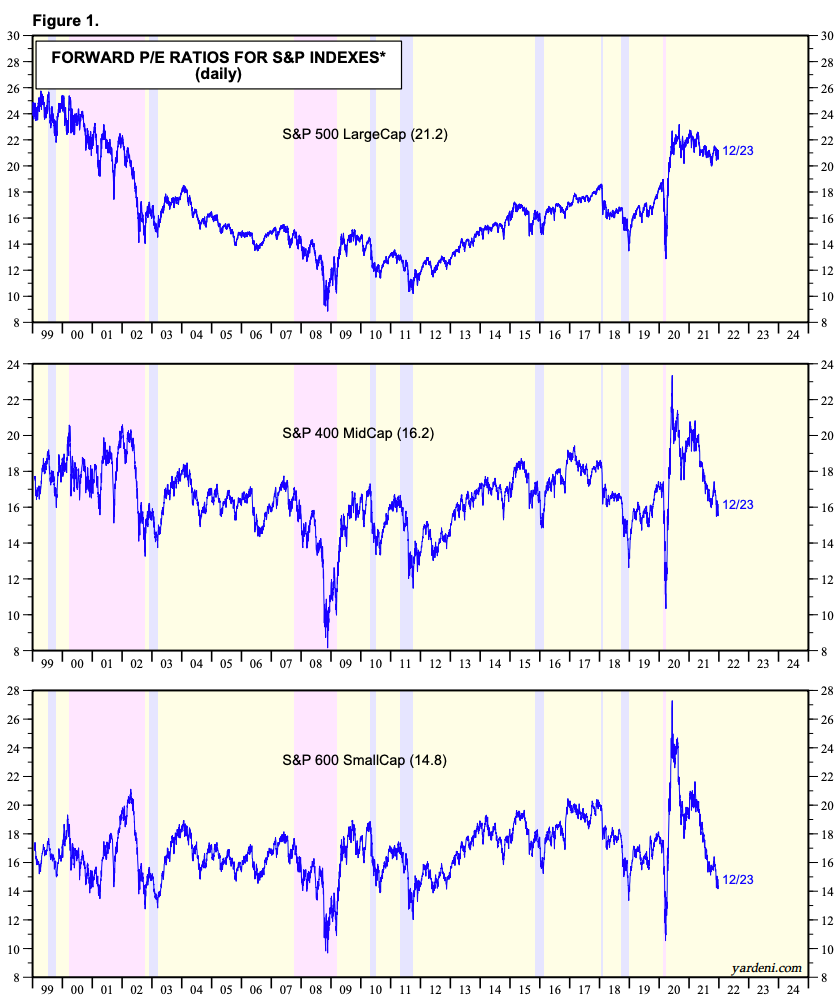
Many other market sell offs similar to the one we’ve seen in 2021 have been substantial corrections, or periods of, in the S&P 500. In addition, since the February market top, stocks have been in what could be perceived as a bear market. However, when we look at the S&P (below) we notice that does not look like the case. In 2014 the market, at least, appeared to stall for a better part of the year and finished with a 10% correction in the S&P 500.
In 2021, our largest correction we witnessed was approximately 5% in the S&P 500 while the amount of stocks above their 200 day moving average drifted as low as 25% in December of 2021. This means there was a stock market crash underneath the market for a better part of the year. On the flip side, index investors and FAANGM investors would never be able to tell or recognize this correction. Their portfolios are likely up 25% - 35% on the year. The only explanation for the S&P’s growing detachment from the overall market is directly related to the weighted of the index currently.
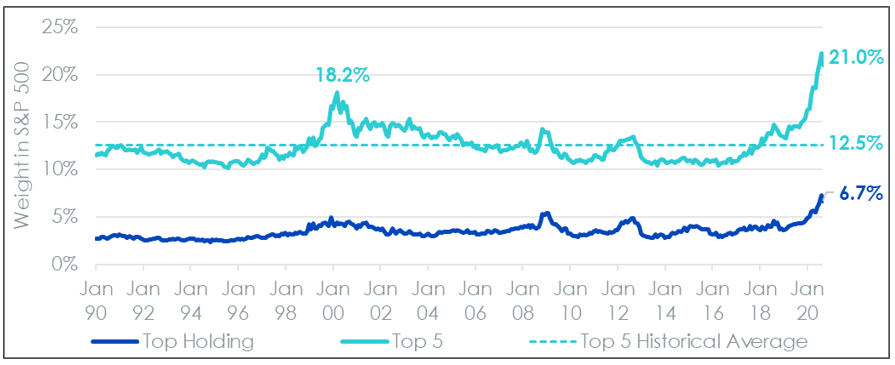
The image above shows the weighting of the top 5 stocks in the S&P 500 but is slightly out of date. Now, it’s around 23% with Apple and Microsoft owning 13% of that weighting. Many investors could look at this and know this isn’t healthy market behavior/functionality. Tech dominates the top 7 positions in the S&P 500
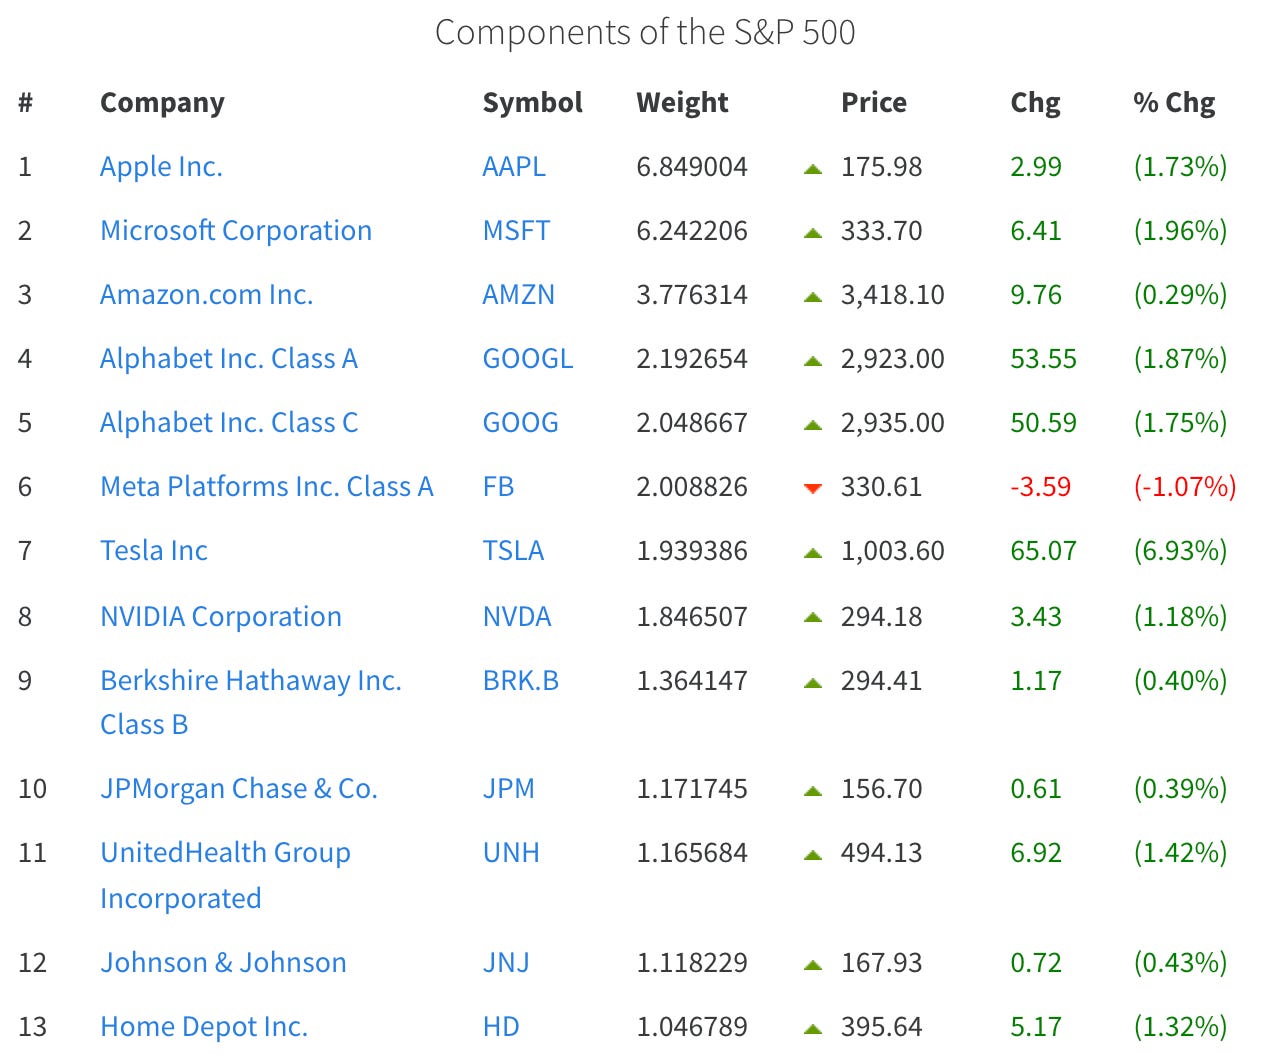
What’s more alarming is that Apple is projected to grow 10% over 3 years (not compounded annually, just 10%) and has a forward P/E of 32 with a TTM P/E of 32. This is insanity! Historically, Apple has never traded at a valuation this high. If it were to fall down to its historical valuation of years past, this would suggest a down side of nearly 30%. Index’s would certainly struggle if the worlds largest company fell in valuation, that’s 100’s of Billions of dollars of market cap.

In Summary, the story of 2021 can be summarized by a misrepresentation of the index’s toward the broader market. However, this ties to the market outlook for 2022 and what we could see. When trades work, they keeping working till they don’t. Eventually, the market has to rotate into a different direction to normalize. It appears likely that money found “safety” and it was “risk off” for the better part of 2021. This means that institutions and larger investors are just buying about 5-6 stocks and completely ignoring the rest of the market. Historically, this never ends well.
I am led to believe that the risk-off sentiment had broadly to do with a lot of the uncertainty in the markets. For example, here are a few things that caused pause all year:
What’s going to happen when the Fed stops QE?
How are interest rates going to respond?
Are growth stocks out and value stocks in because of inflation?
Is inflation actually transitory?
Are we going to see a double dip recession?
Why is labor force participation down?
Are politicians going to lock down the economy from the Corona Virus again?
Economically, what comes next from this?
Does the Fed actually have control?
If this seems like a lot of noise, it’s because it is. Many of these factors are worries and concerns rather than actual events that influence the direction of corporate America and international business. Some may say that these factors are big deals and I would agree but it is all most likely temporary and every factor will be resolved. This means that 2022 will have a vastly different narrative especially as inflation abates.
2022 Outlook & Strategy
As I look forward to 2022, I am judging purely on the likely scenario that could play out over the next few months. This scenario is based off historical data and price action that has ensued from a monetary tightening cycle as well as the insane dispersion that we see between small caps, mid caps and large caps. I often show the picture below for context.
If I were to simply sum up what I expect in the first few months of 2022, I believe we see a rotation out of large caps and value plays. In turn, I believe we could witness a rally beneath the markets while it looks like it is correction or trading sideways. Now, hear me out. There’s data that supports this and it sounds like a complete flip of the script from 2021 but it makes sense when you see how the recent selling is becoming indiscriminate.
Every day since late fall of 2021, we’ve continued to witness small caps get devastated along with growth stocks while cyclicals, energy, value plays, and mega cap tech continue to rally. This means the index’s have rallied (seen multiple expansion) while breadth remains and continues to weaken. This trade is the complete opposite we saw in 2020 where small caps rallied aggressively into January/December while index’s chugged along. I believe we’re positioned to normalize and money could flow to a more balanced market, which could create weakness in large-cap businesses and strength to small-cap.
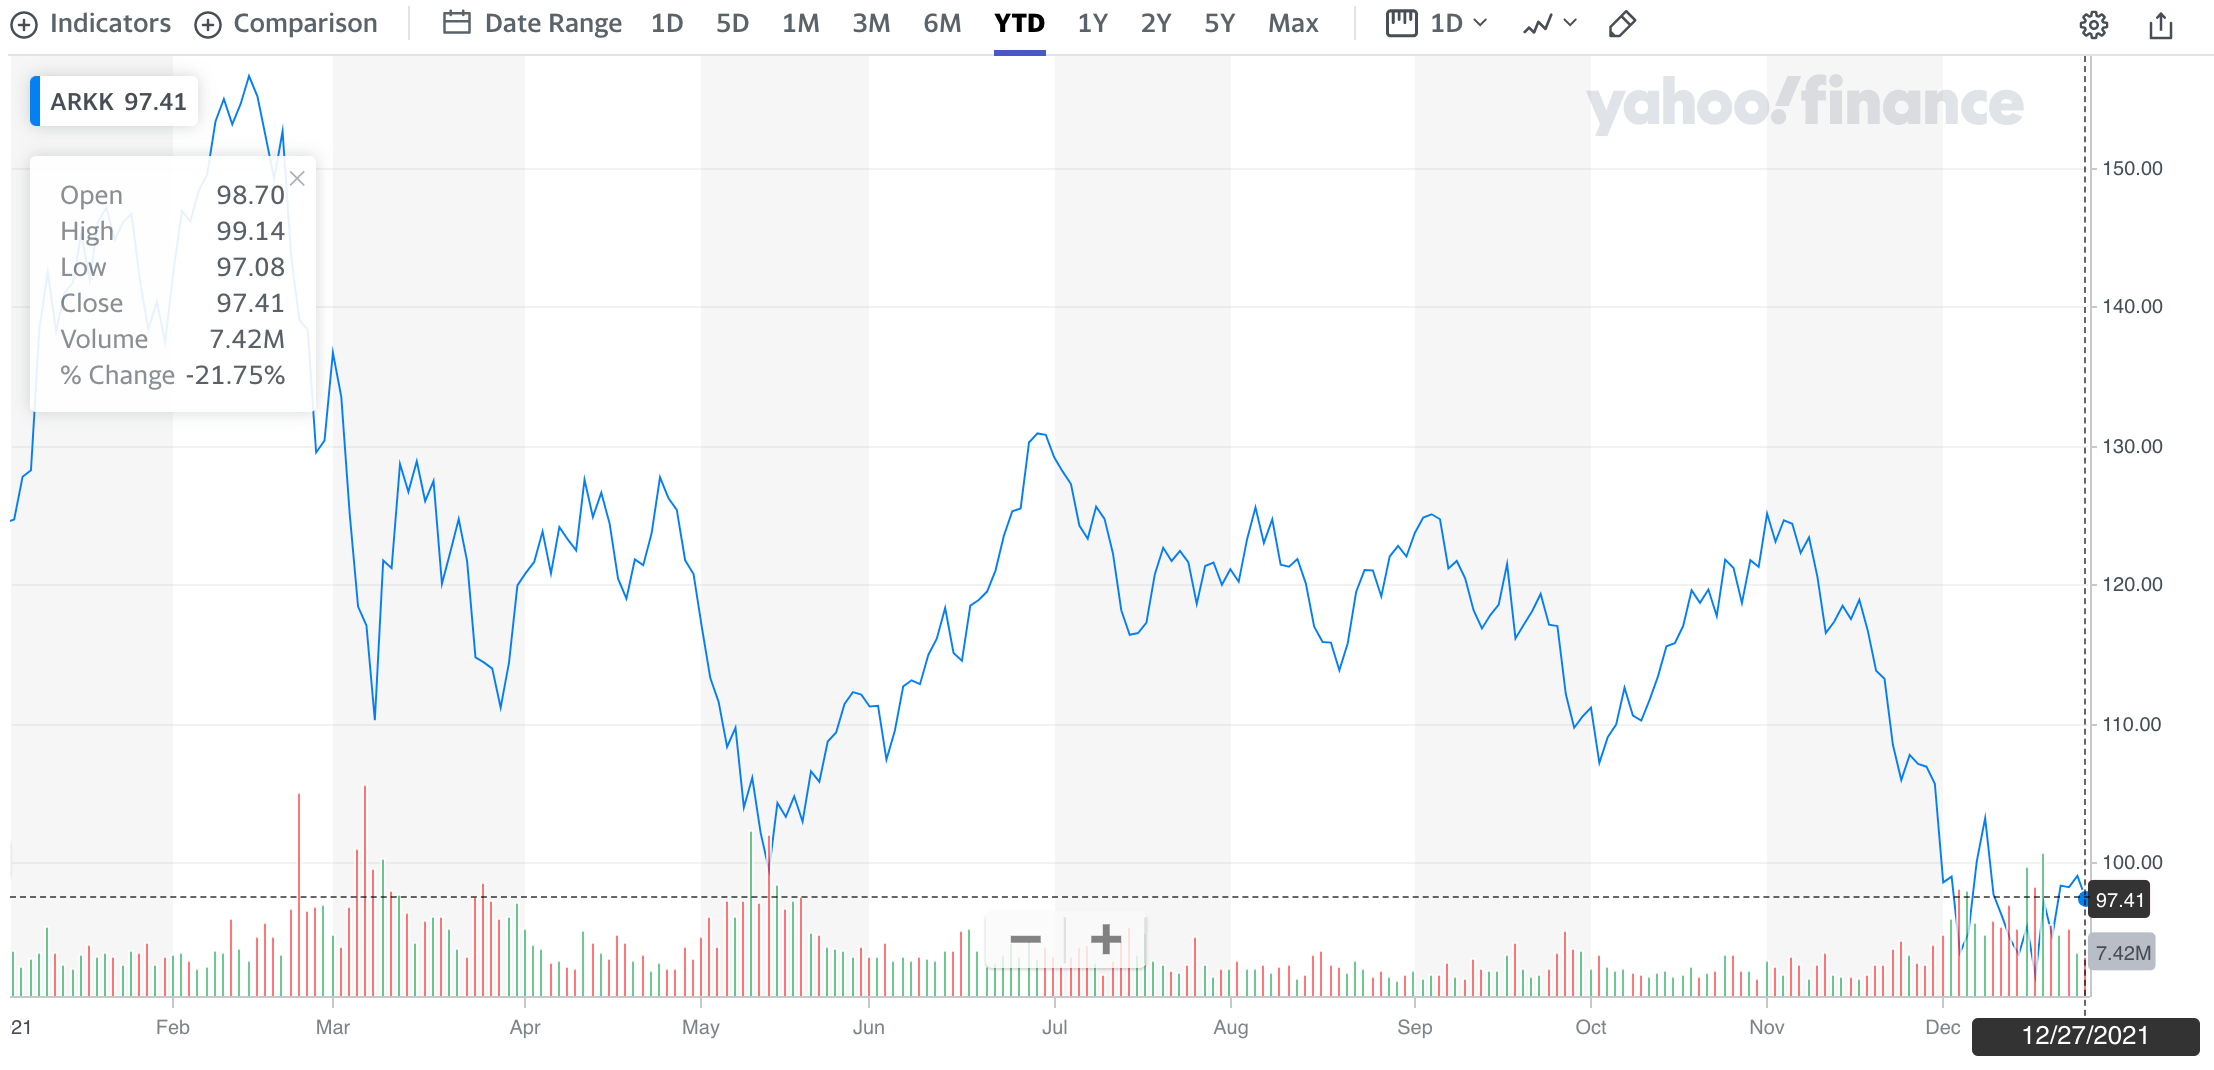
In addition, ARKK’s innovation fund has historically traded with the major indices (slight outperformance) until 2020 where it rallied past the S&P, the NASDAQ and the Russel 2000. This was predominately driven by a euphoric “risk-on” rally but this has turned into a bear market now for the innovation/growth ETF. I believe what we’re seeing now is partially a result from “tax-loss-harvesting” due to ARKK (and many of the companies within the ETF) trading predominately down for the better part of the year.
The thesis is that the trade that has worked all year is being “stretched” as investors do not want to give up their gains and be taxed while the other side of this is “stretching” the market in the other direction. Basically; what has been working and what hasn’t been working all year is on one last breadth for Santa Claus and it appears it will likely flip in January/February. The next 6-8 weeks will be very telling and we could see a major shift in money flow.
It would appear that it’s very likely we’ll experience a significant correction and potential crash in the spring of 2022
Using history as a guide, we can see what happened last time in 2014 during the last monetary tightening cycle.

Typically as liquidity becomes tighter, money will begin to concentrate. More importantly, a lack of QE is a lot like taking the markets off ‘training wheels’ and letting it drive itself. Historically speaking, this may not always be a winning strategy due to how heavily CONFIDENCE drives markets. In other words, if investors are confident in the economic and fiscal policy outlook, investors are significantly more likely to allocate capital into the financial markets. If investors lose the ‘training wheels’, we could see a substantial crash/correction in the S&P 500 and more specifically, Large Caps due to waining economic confidence and bubble like valuations. Let me emphasize the valuations. By any historical text, Large Caps are extremely high in value while mid-cap and small-cap stocks are normalized and would realistically have less room to fall in the event of a catastrophic Bear Market.
Let me show you in a visual what I could see happening over the next few months.

Full disclaimer, I can’t predict the future and this is ONLY my opinion based on the macro data I am aware of as well as historical trends. By no means am I saying this will happen and you shouldn’t trade off it.
While this correction is happening, I would be led to expect a normalization and a close in the gap between small cap and large cap valuations. In addition, many growth names have already sold off 30%+ which means that the rate hikes and tightening liquidity is already priced in. I am led to believe that the two most heavily beaten down groups will benefit and out perform next year while many of the best groups rallying today will drastically suffer in the months to come. It seems too simple but it is that simple, the groups that will out perform are the groups that have the worst scenarios already priced in.
The next part will be members only as I will discuss my personal strategy and portfolio positioning for the months/years to come.
Keep reading with a 7-day free trial
Subscribe to BluSuit to keep reading this post and get 7 days of free access to the full post archives.