I have noticed recently that my news letters have been getting longer and longer. Per the feedback of some members, I will shorten my analysis to provide bullet points while still getting the point across. Today, as we look forward to the week ahead, there are a few things I want to bring to your attention.
The Bull Market has Just Begun
Two Reports that Can Invalidate Everything
Assuming Trend, the Risk That Lies Ahead
The Bull Market
Key technical signals are flashing green, which can indicate there is a new bull market. Today’s market trend and market technicals do not match bearish macro thesis or pessimistic thinking which was conditioned in us, during 2022’s market. This is what I am seeing on both the S&P and NASDAQ.
S&P 500
Daily S&P
The S&P is now trading above all major moving averages on a daily basis (except the 30 day moving average)
The 200 day moving average held as support and is now sloping upward. This has happened during every bull market beginning and has never been wrong since the 1930’s.
RSI is in neutral territory
MACD is beginning to slope upward which can signal a new up trend
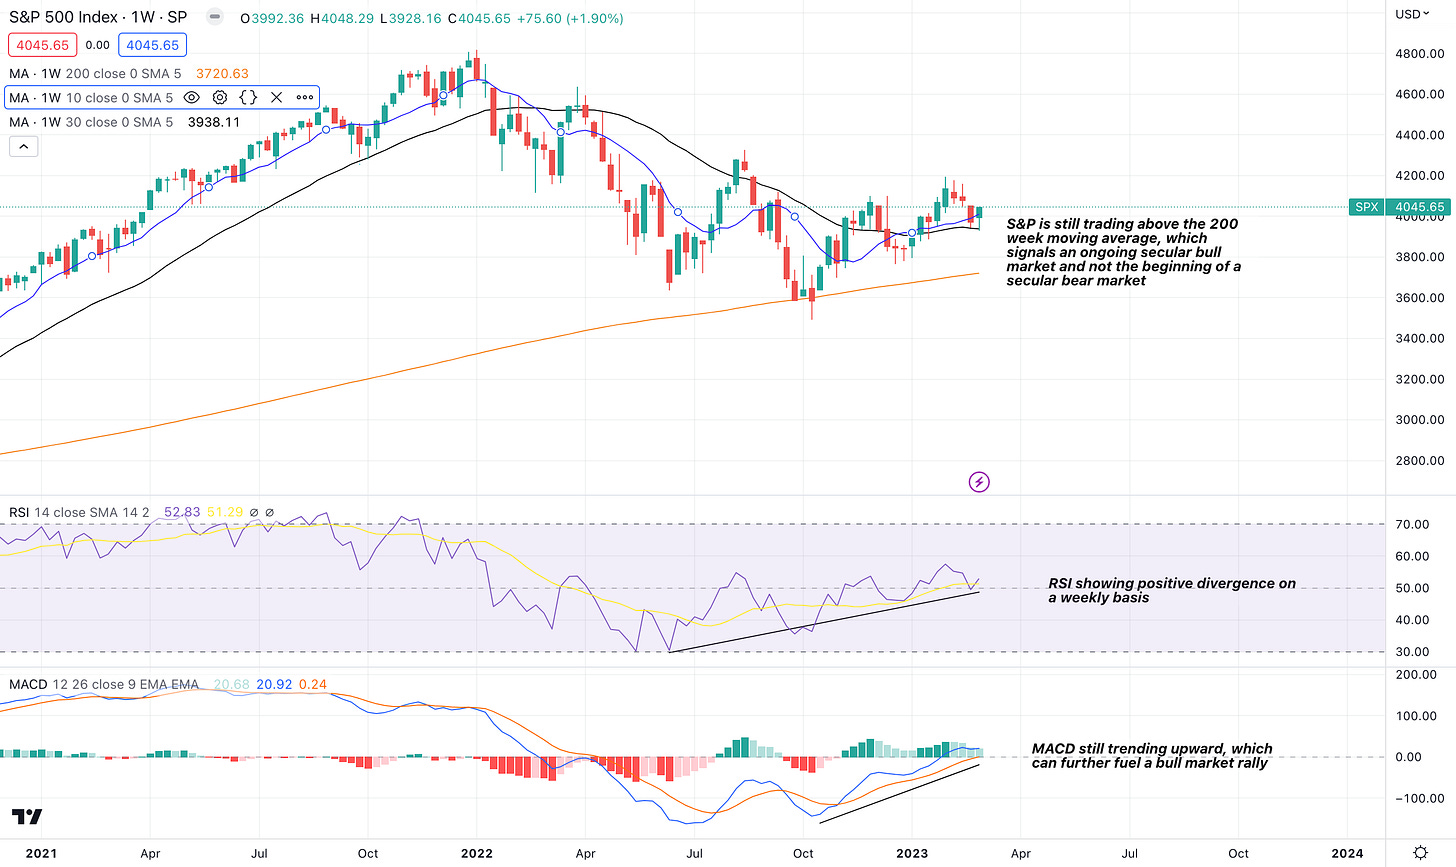
Weekly S&P 500
The S&P’s 200 week moving average is historically a signal of an ongoing secular bull market. We are still trading above this level.
RSI is showing a positive divergence in neutral territory, this is very bullish an can signal an ongoing uptrend on a weekly (longer term) basis
MACD is still signaling an uptrend and isn’t in an overbought area or showing a pending, longer term, down trend
If We Combine both Short and Long Term S&P Technicals
To combine both short and long term technicals, it appears we are going to have an up week this week (macro data releases aside) and we are positioned for a longer term and short term up trend. The market appears to be ready to move higher that could last for some time (technically speaking) and it could, potentially, last several months before there is any sort of meaningful down side. I say this because, historically, breaking above the 200 day moving average, holding it, and seeing it uptrend, signals a new bull market every time.
On a technical basis, when looking at the S&P 500, I am extremely bullish. Knowing what I know about macro, this tells me that the main stream narrative is missing something and the broader market is telling us “things are not that bad” (yet, more on that in a moment). I would assume that inflation data will likely come “in-line” and unemployment may still prove to be resilient. If the market sees something it doesn’t like in the coming few weeks, from a macro data perspective, we could see downside but this trend and market structure is pretty strong.
NASDAQ
Daily NASDAQ
Last week, all major moving averages were recaptured on the daily NASDAQ
Positive divergences across both the RSI and MACD
MACD is signaling an up-trend
50 day moving average is above to cross above the 200 day moving average, this is also known as “the golden cross”
200 day moving average is flattening out and should begin sloping upward in the days to come
Weekly NASDAQ
Weekly NASDAQ confirms what we are seeing on the daily. A bullish uptrend is confirmed and ongoing on both a short and long term basis.
Positive divergence between MACD and RSI is a bullish development
It’s important that the NASDAQ is still above the 200 week moving average to signal an ongoing secular bull market and not a secular bear market like what began in 2001 & 2008
If We Combine both Short and Long Term NASDAQ Technicals
An uptrend seems obvious in all tech stocks and since we are coming off nearly 40% down (from peak to trough in this bear market), this is extremely bullish and should signal some sort of confirmation to buy tech. On both a short term and longer term basis, there is a lot of reasons to be optimistic at these levels and these trends. As a bonus feature, the monthly NASDAQ equally caught my eye as bullish developments seem obvious.
There are lots of buying signals that are demonstrating that the markets are ready to resume their upward momentum for the next few days/weeks/months and possibly years
Despite Bullish Technicals, this is What We Should Watch for
Keep reading with a 7-day free trial
Subscribe to BluSuit to keep reading this post and get 7 days of free access to the full post archives.


