Analyzing the Financial Markets
Reviewing, and explaining, the technicals and fundamentals in the financial markets
Technical Analysis
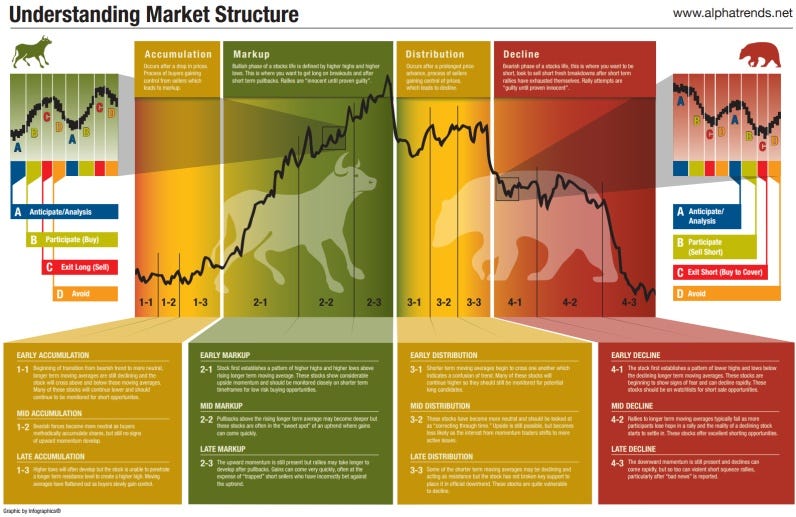
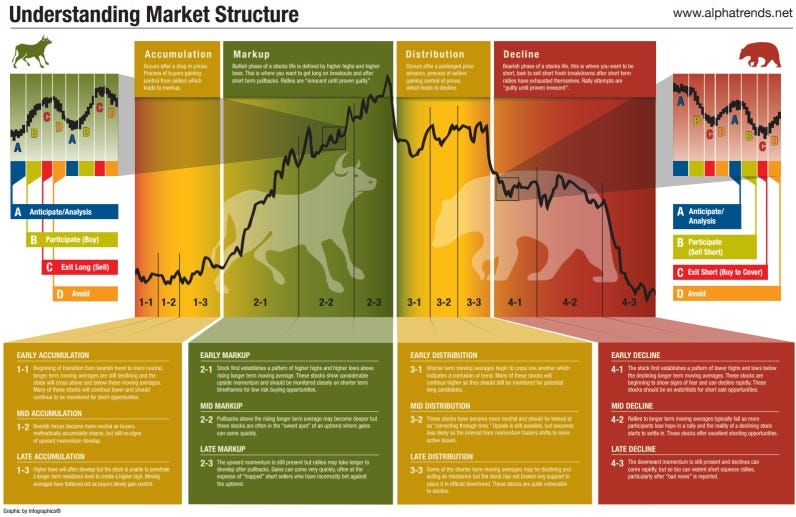
I find it extremely helpful to gauge, and benchmark, my own market hypothesis with what the broader market could potentially be thinking. For example, today, I see many investors fighting against the tape, still trying to find an opportunity to short or even sitting with a significant amount of cash on the sidelines. The trends and market structure just don’t support a bearish hypothesis (despite macro) today. The market technicals are so strong that if I didn’t know anything about macro and only looked at what the technical structure (and trends) are telling me about the markets, I would assume the bear market is over and we are in the middle of a rally back to all time highs. This is something I knew I needed to share with all of you, the thousands of readers who enjoy BluSuit’s content. I think we are in 1-3/2-1 phase.
As many of you are aware, I believe that the markets bottomed on peak inflation a few months ago, rather than the Fed pivot, because we are in an inflationary market cycle. But today, I am going to distance myself from the macro conversation and analyze the market technicals to show you what I am seeing to compliment this macro analysis. We will analyze the internals of the market, valuation, structure and technical patterns. The order we will review this information will be:
The S&P 500
The NASDAQ, &
Growth Stock Markets
By the end of today’s publication, this analysis may provide the right information that can be applied to the strategy you’re setting for your portfolio. I think you are going to be surprised to see how well the markets have done despite the extreme bearish sentiment we have experienced as well as how the trends are developing. It’s as if institutional investors are saying one thing and doing another because it’s Wall Street, not retail, that runs financial markets.
It’s fair to say that any trend that is developing can be completely invalidated in any sort of positive or negative macro event. However, there’s a rule to apply to this. The positive or negative events must be unknown and a surprise. If the market already knows the information (the Fed raising rates) this will likely NOT invalidate or disrupt the emerging trend.
For example: If a once in 100 year health event like COVID comes through the markets, this is enough to create a capitulatory sell off. Or visa versa being the Fed suddenly announcing $120B/month in QE to cease (like what happened in response to COVID).
S&P 500
On Friday, we sold off into a three day weekend (which historically always happens) as traders de-risk. In addition, it was Options Expiration day which can mark significant turning points in the markets. For example, the markets bottomed in 2018 and 2020 (during those last two bear markets) on OpEx. The selling wasn’t a surprise. On Tuesday, markets will reopen with all eyes on Wednesday’s Fed Minutes release at 2:00 pm EST.
From a technical perspective, it wasn’t hard to see the short term correction the S&P had to go through this month. I didn’t hedge because I didn’t see a rationale to hedge (hedge’s can destroy your returns if corrections/pull backs are too shallow). Usually, after markets begin to recover from a devastating bear market, the markets will go through a period of disbelief and consolidation while the macro clears. The 30 day or the 50 day moving averages needed to catch up to market price action to justify the next uptrend (from a technical perspective) as bull markets have a tendency to crawl that wall of worry.
Looking at the S&P 500 above we see a few things:
Above all major support zones
Above all major moving averages except the 10-day moving average (which is the weakest)
RSI is no longer “over bought” justifying conditions for a continued rally
MACD is signaling a bearish downtrend (this can produce false signals)
200 day moving average is beginning to slope upward (which has signaled new bull markets)
The S&P 500 got the “golden cross” which is when the 50 day moving average crosses above the 200 day. This is historically a technical signal of a bull market. In the past, after major market corrections, these are the moments the 50 day moving average had crossed above the 200 day since the 1960’s (the past 60 years). Historical context below:
Weekly S&P 500: Weekly trends are more important than daily trends as they are stronger and more structural. Historically, secular bull markets climb above the 200 week moving average for years till the bull market is over. The Weekly S&P below:
The weekly chart on the S&P 500 really tells the full picture from a trend and structural perspective. There are few things we see here:
A strong bottoming pattern called “the inverse head and shoulders”. This signals that large investors are buying and accumulating at certain zones and price levels. Once enough has been accumulated, the markets begin to resume its uptrend.
Trading above “the neck line” on the inverse head and shoulders
Trading above the 200 week moving average, which signals continuation of the secular bull market
RSI strong relative strength, which signals positive momentum
MACD is very bullish on a weekly basis, signaling an uptrend has been in place for a few months
Fundamentals of the S&P
Underlying breadth and valuations of the S&P are showing bullish trends as well. To get an idea of the breadth, we can analyze the percentage of stocks above the 200 day moving average. This way we can get an idea of the broader strength in the indices.
Below, we can see that this break down (of stocks trading below their 200 day moving average) and recovery is consistent with previous bear markets. Rarely has the S&P went below the 15% mark and rallied above 60% of stocks trading above the 200 day moving average without it signaling a new bull market for at least a few years.
Valuations (below) are also starting to expand, which historically, signals the end of a bear market. Below, it is note worthy that we appeared fully valued on the large cap index but are witnessing multiple expansion in small and mid cap stocks. Although, a key bear argument is that “stock are still expensive” this just isn’t true outside index’s stocks. Small caps and mid caps were priced for recession and reached 2008 levels. I have predominately assumed this is the core reason why we have had a “risk on” rally as small cap stocks are considered “risky”.
As we move out of Q1 2023, the market is beginning to price in Q1 2024’s earnings. Recall that the S&P, historically, trades on a “forward” PE as investors discount the future. Below, we can see that earnings have already anticipated a contraction this quarter (and next) but the market is expecting roughly 11% earnings growth in 2024. Between consumer price growth and inflation likely to cool (fueling easing monetary policy) back to trend it seems likely that we have some sort of growth, this year and next, in earnings as the Fed eases credit conditions.
To Summarize the S&P 500
The S&P is the most important market to pay attention to because it’s the bell weather for all other markets. If the S&P 500 is weak, all other markets are weak. If the S&P 500 is strong, other indices are likely to follow suit. To specify, I often analyze what the S&P 500 is doing first before I make judgements/predictions about where the NASDAQ is going. I must see strength here first.
We are seeing strength in the S&P 500 from a technical perspective. As the days go on, investors will begin to price in 2024’s earnings (which are expected to grow 11%) making an uptrend likely to continue, pending any black swan or significant deterioration in the labor market. If the S&P 500’s earnings do grow 11% in 2024, at a forward P/E of 18 this would place us at a S&P 500 price target of 4,500 by the end of the year. This is roughly 12.5% up from today.
NASDAQ
I don’t believe the S&P was truly reflective of the devastation 2022’s bear market had. Looking back at the past three years, from now, we got hit with the COVID-19 pandemic, locked down the world, passed massive amounts of fiscal stimulus, created a financial bubble in all assets, experienced 40+ year high inflation and are now going through the fastest hiking cycle in history….
Wow, that’s a lot
These events are a lot for any financial market (or economy) to handle. Still, regardless of all of these events, we are in the middle of what seems to be an economic recovery. The economic recovery, however, created some sort of unusual flow of earnings and capital. What I mean by this is that during the pandemic; we had some major pandemic beneficiaries like nearly all e-commerce and tech. Bad, or otherwise, not extremely valuable companies, were rapidly adopted and experienced accelerated revenue growth.
The result was a tech heavy NASDAQ benefitting from the initial economic recovery but fell off a cliff, nearly 40%, from peak to trough in 2022’s bear market. The technical structure that has been developing since mid 2022 appears poised to break out (after consolidating) and the vast majority of the selling is behind us. Now, we are seeing a few things in this market:
The market has been consolidating since May/June 2022
We experienced a double bottom, once on October (with the S&P) and once in early January/late December
Currently trading above all major moving averages except the 10 day
RSI still slightly over sold and moving toward neutral territory
MACD needs to level off or come down
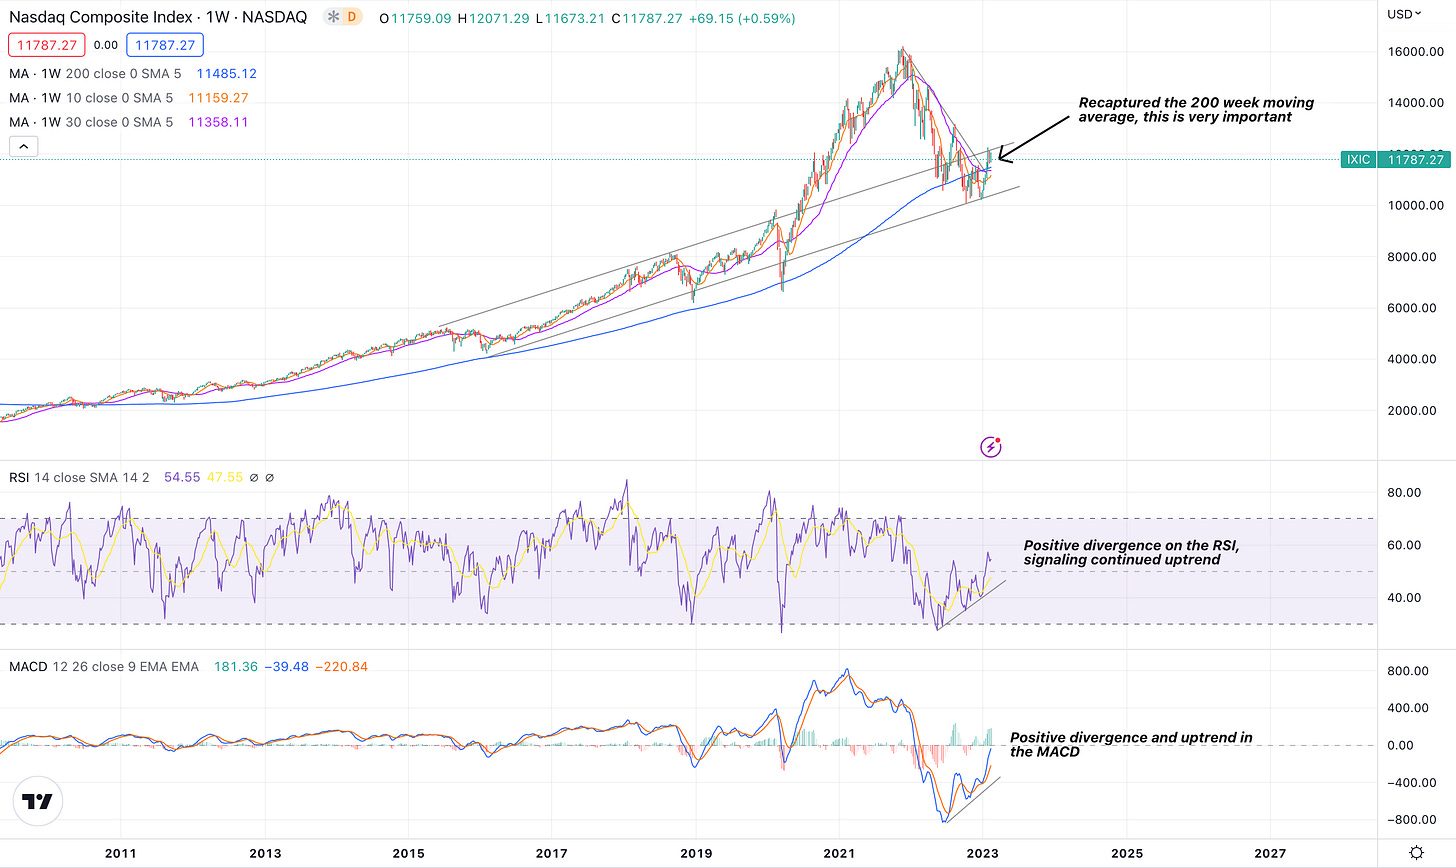
The way I am reading it, on the daily chart, the NASDAQ looks strong but slightly over bought. We could see a period of consolidation. On the weekly chart (below) for the NASDAQ, the trend looks significantly more defined. It first shows just how crazy things got during COVID-19 lock downs.
However, we appear to be back at the same trend we had prior to the pandemic (which is a good thing). There are a few other data points I wanted to bring to your attention:
On a weekly basis, the NASDAQ still finds itself in an uptrend on the RSI and MACD. These are very strong.
Reclaiming the 200 week moving average is very constructive for the bulls. We really didn’t want to see a rejection at this level.
Structural uptrends on the NASDAQ’s weekly chart are very strong. It’s not necessarily saying that the markets can’t go lower but it is saying something significant would need to take place to invalidate the sideways trend we have had since middle of last year. Tech stocks are likely to find themselves consolidating for a short period of time but resume in an uptrend after consolidation.
To further build on the case for an uptrend, underlying breadth (shown above) is extremely strong. Historically, once the NASDAQ trades below 10% of stocks trading above the 200 day moving average and recovers to over 40% of stocks trading above the 200 day moving average, this signals a new bull market and the correction/crash is over. This tells us that there are significant amount buyers stepping back into the markets. This buying is likely to continue.
Growth Markets
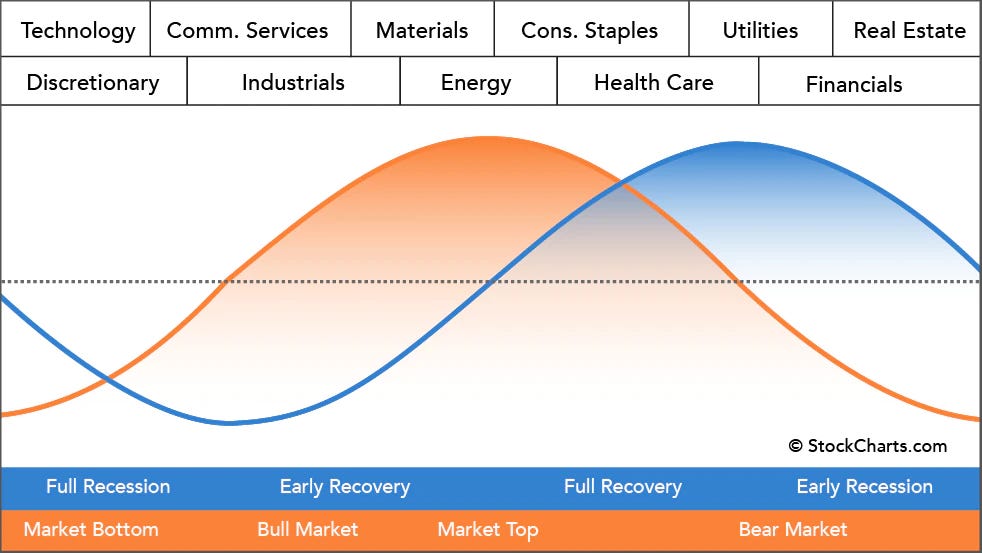
As a continuation of the NASDAQ analysis, I knew it would be important to include the secular compounders. If there is any question that tech will lead us in a new bull market, you have to ask if that individual is “ok” (just kidding) because that’s where the earnings growth will be, assuming its a well run business. As we can see above, when technology and secular growth stocks begin out performing the broader indices, it signals the beginning of an economic recession and recovery in the markets. One of the best markets to purely represent the technology sector is IGV 0.00%↑.
I have found many times that my portfolio trades relatively close(ish) to the IGV 0.00%↑ since this is the software and technology index in the S&P 500. There are a few key things to note here:
We have traded sideways for months, since May of 2022
We are finally above all major (daily) moving averages
Currently trading at support and the 30 day moving average. This means we should bounce at this level and trade sideways for some time.
Both the RSI and MACD are showing negative momentum on a daily basis, which can simply mean we just need more consolidation
On a weekly basis, the uptrend is significantly more defined (similar to the S&P and NASDAQ). The RSI and MACD are in an uptrend while also showing strong positive divergence. A few other things that are more pronounced on IGV’s weekly:
Inverse head and shoulders pattern is obvious
Rejection at the 200 week moving average is very concerning but if we recall the daily chart showing overbought conditions, along with both S&P and NASDAQ trading above their 200 week ma, I have less concern.
Growth stock multiples (below) look extremely healthy and have room to continue to expand. Recession or not, many have already guided down massively and reflect
It is extremely notable that many earnings calls that I have listened to (which have been mostly tech and growth stocks) have guided down their earnings forecast in anticipation of a tougher macro and economic recession. These secular compounders are still guiding for 30%+ growth with many being free cash flow positive. Not only have secular growth stocks experienced meaningful multiple contraction, they have also been priced in for recession. As a side note, this is a massive opportunity in my opinion.
In addition to the IGV, I also follow SKYY ETF (above) which is a cloud computing ETF. This appears to be the closest in correlation to my style of investing (and often what I use to hedge against). The bullish momentum has actually just begun here. This is what I am seeing:
Crossed above the 200 day moving average which looks a lot like the 2-1 phase below
Positive momentum across the board between the MACD and RSI
Currently trading above all major daily moving averages except the 10 day moving average
On a weekly basis for SKYY, the trends are just as bullish if not more. All trends are pointing up and should show relative strength over many other markets (similar to IGV). It wouldn’t be surprising to me to see growth stocks and software stocks outperform in a very big way in 2023. Not only is the technical picture set up to out perform, the underlying fundamentals in (profitable) growth stocks shouldn’t need too much economic growth to continue fundamental business growth of 30%+.
To Conclude the NASDAQ & Tech
Underlying strength in NASDAQ & tech stocks is extremely encouraging as this can signal a market bottom. Once they begin to out perform, this means that we are likely in the middle of a recession but are at market bottom. Once the economy begins to show signs of expansion (inflation cools, earnings expand, etc), many of these growth stocks and tech stocks will catch a further bid as earnings are revised upward.
The breadth of the NASDAQ and emerging trends after a prolonged consolidation will likely lead to tech stocks out performing this year. In my opinion, shorting tech no longer makes any sense considering valuations have contracted and many of the FCF negative companies have been bombed out. It makes substantial sense to increase risk in this sector of the market especially when/if the sector sells off further. It looks like we are at, or slightly above, bottom.
Looking Forward
As I mentioned I would stay away from Macro but this weeks FOMC minutes will likely move markets. Pay attention to the key levels laid out here in both the S&P 500 and NASDAQ (tech). I believe we should have a green week (depending on data) and expect (as long as trend continues) to see continued recovery in the financial markets for the remainder of 2023. Not only do my macro publications support this thesis but so do the underlying technicals of the financial markets.
I do hope this was helpful. I have a really great (next) Substack coming out where I talk about my process and review my whole portfolio. Don’t miss it.
Stay Tuned, Stay Classy
Dillon


Another outstanding read Dillon. Really appreciate the effort you go to. You have such a talent for communicating on the markets that makes things so easy to understand and digest. Keep it up and thanks for your hard work. Be interesting to see how things play out next week and for rest of 2023 going forward.
Great level of detail, and thanks for all your hardword.