Fed Watchers Will Under Perform in 2023
The Most Hated Rally isn’t Irrational. Its Rationale and Fed Watchers are Wrong to Wait for Conditions to Ease.
It’s the Economic Cycle that Moves Stock Markets, not Liquidity
The prevailing market theory, for some time, especially since the Great Financial Crisis, is that central bank liquidity is what drives financial markets. An entire trading style “the Macro Investors” have centered their philosophy around this very principle. The thought is that you respond to what the Central Bank (Fed) is doing and, well, you make money. 2022 was a great year for the Macro Investor.
This thought has become main stream and I believe that this (current) market cycle is the market cycle that will prove that trading on Central Bank policy isn’t as full proof as people believe (when it comes to equities). That, in fact, it is the economic cycle and the outlook for economic activity in the future that dictates the prices of stocks due to how it impacts corporate earnings.
Inflation and record central bank tightening was what made macro investors a killing in 2022 and will be why they lose in 2023… UNLESS investors adopt a broader philosophy of thinking economic cycle first and liquidity second. After all, the liquidity doesn’t directly inject earnings into a company’s quarterly results but indirectly impacts the consumer prices that are factored into earnings results of individual companies.
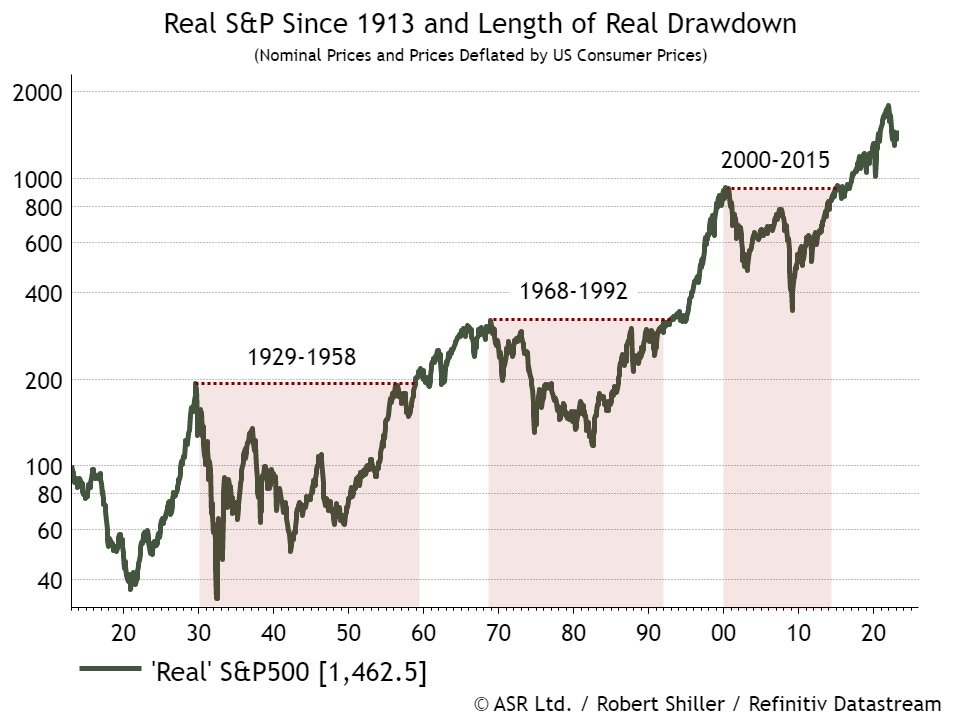
Consumer Prices are a Massive Part of Earnings Growth and Have Been Since the Early 1900’s. The Chart Below Shows the “Real Returns”. This Will Be Important to Remember Throughout Today’s Publication.
The Central Bank (Fed) is a mediator of the economic cycle, the economic cycle dictates how strong/weak corporate earnings are going to be due to the expansion or contraction of economic activity. The more economic activity, the better corporate earnings are going to be. The less economic activity, the worse earnings are going to be. Earnings ultimately drive stock prices.
Today’s Format:
Inflationary and Deflationary Economic Cycle
Inflation and Jobs Data Today, the Trend and Why the TREND Matters
Historic Precedent
Inflationary vs Deflationary Market Cycles
We are in the predicting business as investors/traders. Our goal is to play offense when the odds are in our favor and defense when the odds are not in our favor. Some believe that you can time the exact bottom or the exact top, but, that’s not the “specific” goal. We just have to get near the tops and bottoms. The problem with the VAST MAJORITY of investors is that they play offense near the peak of a market cycle and defense near the bottom.
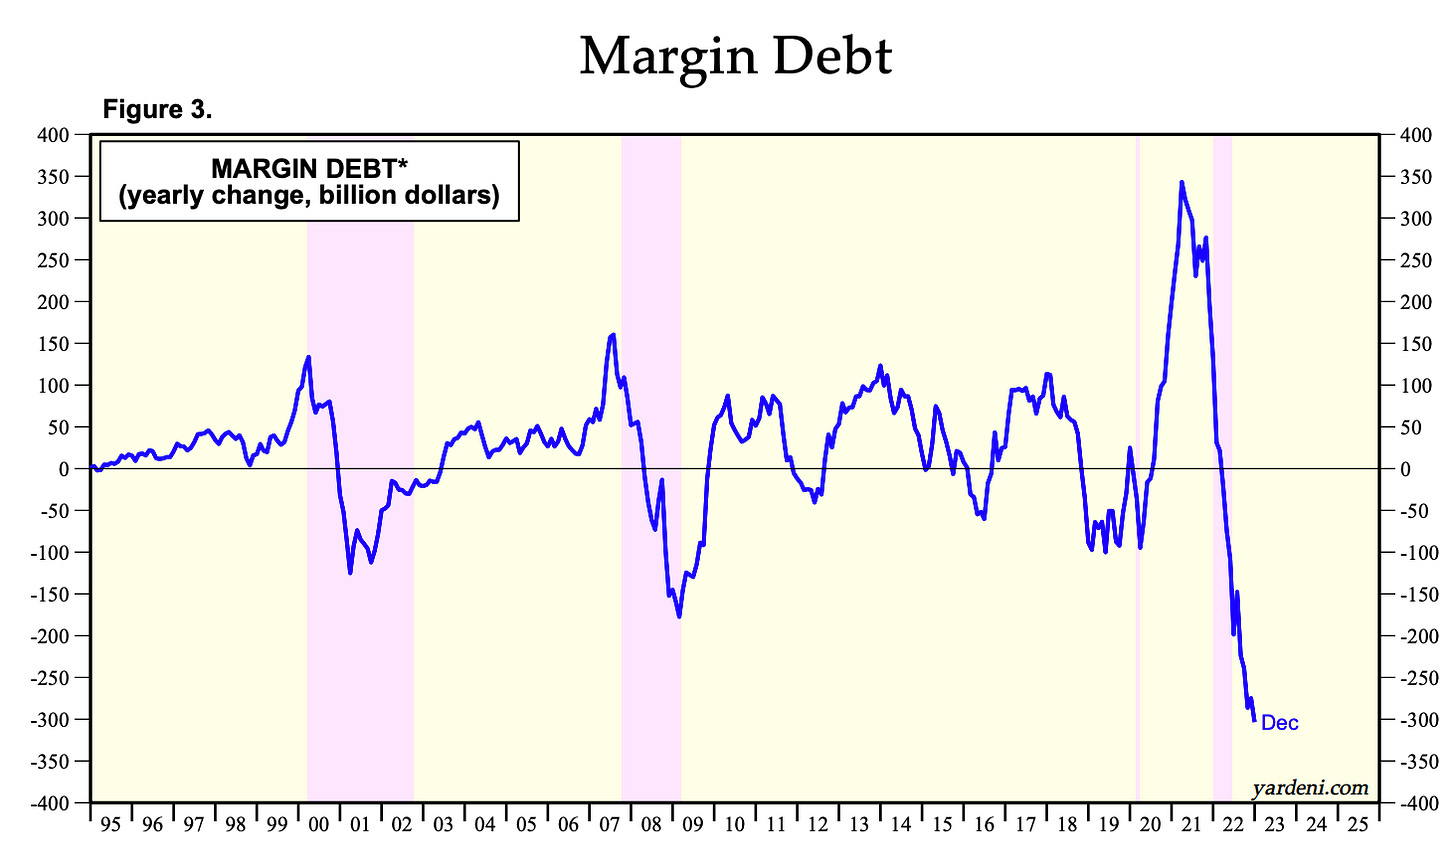
Margin Debt Usually Bottoms on Market Bottoms and Peaks at Market Peaks
Understanding The Market Cycle Helps Investors Play Offense When It’s Time to Play Offense and Defense When it’s Time to Play Defense.
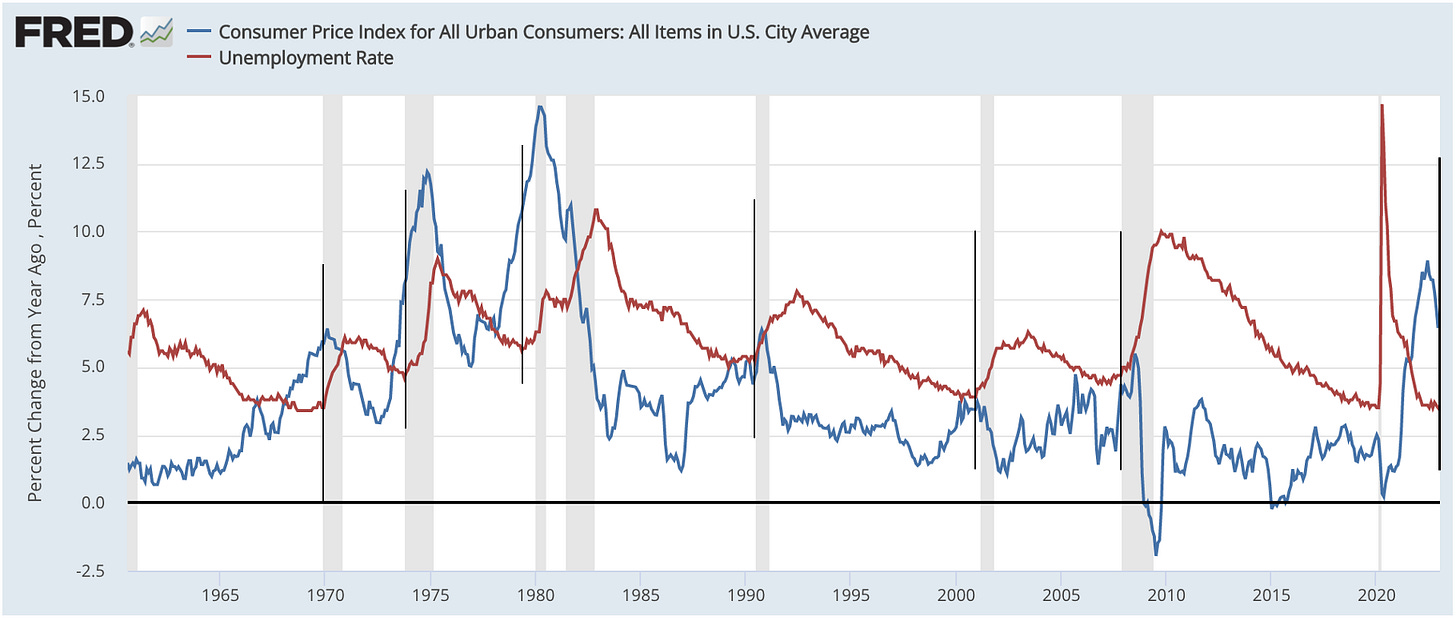
Today’s market cycle is different than any other market cycle over the past 50+ years. Historically, inflation begins rising toward the end of the business cycle as unemployment goes lower. Then, unemployment must go up to bring inflation down to slow economic activity down “enough” to bring CPI back to balance. Today we have record low unemployment with inflation already peaked back in June of 2022. Below are two images that help contextualize this relationship.
Notice how the peak in inflation is to the left of the black line this time, not the right. The black line signals the absolute bottom in unemployment before it started rising.
How This Works
Inflationary and deflationary market cycles are fundamentally different. One is a result of economic activity being too sluggish and the other being too hot. Think of inflation and deflation as the byproduct of unsustainable economic growth or contraction, it’s a symptom of a larger issue. An ideal environment for inflation/deflation is 2-3% inflation with low unemployment under 4%. When unemployment goes too low, inflation historically heats up. When unemployment gets too high, deflation usually takes effect.
The image above provides a good analogy for how to think about the economy and the deflation/inflationary market cycles. The car is the economy and Jerome Powell is the driver. Jerome Powell’s job is to keep the economy moving forward at a good speed. If the car is going too slow, he will need to speed it up. If the car is going too fast, he needs to slow it down. He does this by adjusting monetary policy, or using the breaks and gas pedal in our car example.
When thinking about today, Jerome Powell needed to hit the breaks suddenly in 2022. But why did he need to do this? Well… They printed too much money. Notice the break in trend (below) in M2 money growth. Another way to think of this, he sped the economy up to go 90mph but the speed limit was only 65mph! He had to quickly slow the economy down before this became a bigger problem than it already was.
So then, for us as investors, the question becomes when do we play offensively? Do we wait for the Fed to ease monetary conditions? I’d strongly argue, no. Let me explain more, using history.
Timing Market Bottoms in Both Market Cycles Requires an Investor to Understand the History of Inflation and Deflation
In my bottom call publication (below) I spoke about the relationship between inflationary market cycles and market bottoms in depth.
The main point was identifying the relationship with peak CPI and stock market bottoms. Every time, during an inflationary market cycle, the market bottomed on peak CPI, NOT THE FED PIVOT.
CPI Peak - Note the Dates
Market Bottoms - Note the Dates
After inflation begins to ease, I assume the investors main concern (the economy becoming too hot and hyper inflation) begins to ease. Let’s go back to thinking about the car example (below) for the inflationary market cycle of 1966 - 1980, ideally we wanted to be going 65mph but the car went too fast during this time and sped up to 80 mph (multiple times). Now historic monetary policy put the breaks on the economy and as the car slowed down, I believe that the market began anticipating when the Fed will take the breaks off as inflation falls. Once the stable trend is reached, stocks go back up and economic risk is decreased which improves an investors risk appetite, prompting them to buy.
On the reverse side of the equation, imagine our car is going too slow (deflation) and we need to speed up. This example is effectively the environment we have been in for the past 15 years (since 2009) before we entered into an inflationary regime in 2022. Over the past 15 years, investors have coined the “Fed Pivot” to be when we need to pile back on to stocks. I mean, with due cause too. It is all investors have known. But there’s a problem to this.
The relationship (below) of QE to market price action. It’s noteworthy that from 2016 - 2018 they were raising rates in an attempt to slow the economy because unemployment reached historic lows and the economy was too “strong”, risking an inflationary episode.
In the beginning of this publication I mentioned:
Few investors (even some money managers) around today experienced the 1970’s inflationary decade. If they did, I would assume that they would expect the market to bottom on peak inflation, not a Fed pivot, because the challenges in the structure of the economy were unique in both circumstances. But for those of you reading, you will have a “leg up” on this overly conventional thought process.
To Simplify
The stock markets relationship between inflationary regimes and deflationary regimes is note-worthy. During periods of inflation, the market bottoms on peak CPI and during periods of deflation, the market bottoms on the Fed Pivot. This has to do with where the economy is at during a given economic cycle. During periods of deflation the Fed easing monetary policy will speed up the economy from its sluggish pace and during periods of inflation, the Fed will slow down the economy from its sped up pace using tighter monetary policy.
If we are in an inflationary market cycle, earnings growth is already accelerated due rapidly expanding consumer prices. In a deflationary market cycle, earnings growth is decelerating because consumer prices are contracting.
Notice the level of draw down on an inflation adjusted basis during deflationary periods
Consumer prices directly impact corporate earnings because stocks are productive assets, which means that inflationary costs can be passed down to the consumer. An increase in consumer prices directly impacts the S&P 500’s valuation that we use to gauge whether stocks are “expensive” or “cheap”.
S&P 500 Earnings Forecast - Note 2023 and 2024 EPS Forecast
S&P 500 Forward Earnings Multiple Forecast
S&P 500 Price Action Forecast
The above three images provide an example of how Wall Street thinks about the correct valuation of the S&P 500 and where it should be trading. This dictates whether or not investors will buy, or sell, the S&P and the respective stocks within the given market. Expanding or contracting consumer prices play a massive role into the earnings outlook for the S&P 500. For this year, earnings growth will likely come in the form of expanding CPI and will decline on a “real” (inflation adjusted) basis. This still justifies earnings growth on a nominal basis, which will impact stock prices.
Todays Inflation & Employment Trends
Figure 1 (above) was taken from the Wall Street Journal. The reason why this image was so important is that it contextualizes the way Wall Street is thinking about inflation, employment, the 10 year treasury yield and ultimately, economic growth. To break this down, Wall Street has economic models built in that help them decide when to buy and when to sell. Their purpose is to exploit future opportunity in earnings and earning expectations of individual companies by gauging exactly what the economic productivity will be in the next 3, 6, 9 months.
Algorithms, built by institutions, control financial markets. These algo’s ingest massive sums of data, interpret the data and move markets based on future outlooks/models that can help exploit pricing discrepancies in stocks with expectations of earnings over the next 3, 6, 9 months.
Jobs and Inflation Today, Why the Trend Matters
At the time of writing, this is the weekend before CPI release on Valentines day. I have no clue what it will come out to be. I am assuming it comes in lower than last months data (pretty easy to assume) because of the trend that’s taking place today. The declining CPI trend is important because as long as the Fed “keeps at it” they will eventually control deflation.
Figure 2, also taken from the Wall Street Journal, describes exactly why the markets are rallying
Figure 2 (above) describes perfectly why the markets are rallying. Let me explain.
If Inflation Continues to Comes in Lower Than Expected, this Moves the Projections on the Federal Funds Rate, 10 Year T-Bill, and the Expected Unemployment Figure
Going back to what I mentioned above, the uniqueness of this market cycle being that inflation peaked before unemployment began to rise, this is NOT LIKE PREVIOUS INFLATIONARY MARKET CYCLES AND OTHER BEAR MARKETS. What this means is that the Fed can continue to combat inflation (trending in a positive direction) while unemployment stays relatively strong. This means that, if the market begins to see some sort of deflation….
The Federal Reserve Will Have Room to Ease Monetary.
Due to rates being so high.
The Key Data Point is Inflation
To summarize; inflation is everything. If inflation falls faster than expected, we can get back to a point where we have stable economic growth in a lower inflationary environment. If inflation truly proves to be transitory, due to COVID shock + massive monetary stimulus, and not structural (like the 1970’s), which I don’t think it is, this is a time to play offensively. The only question that remains is… Is this possible?
In 1951, there was a sudden surge in inflation and money supply after the government expanded its spending and there were supply chain shocks. But, looking below, this proved to be cyclical and not structural. The stock market knew it too.
Looking back to 1951, this was a lone example of when inflation fell without a devastating recession or a surge in unemployment. That year, the US Government ramped its defense spending and the Fed responded accordingly. More importantly, stocks never truly crashed like what happened in the devastating bear market of 1974. Unemployment stayed strong, inflation came down and the economy improved over the next few years.
Looking Forward
I will keep all of you updated (with what we are seeing) in the days/weeks/months ahead. Obviously, there is little that can be predicted when it comes to Black Swans but there is much to say about navigating the market cycle to get “a good idea” when to play offense and defense. There are always leading indicators that flash warning signals before markets collapse, we just need to know where to look.
Stay Tuned, Stay Classy
Dillon


Brilliant read Dillon. Read through a couple of times. Extremely helpful and your analysis is detailed and informative...as always.