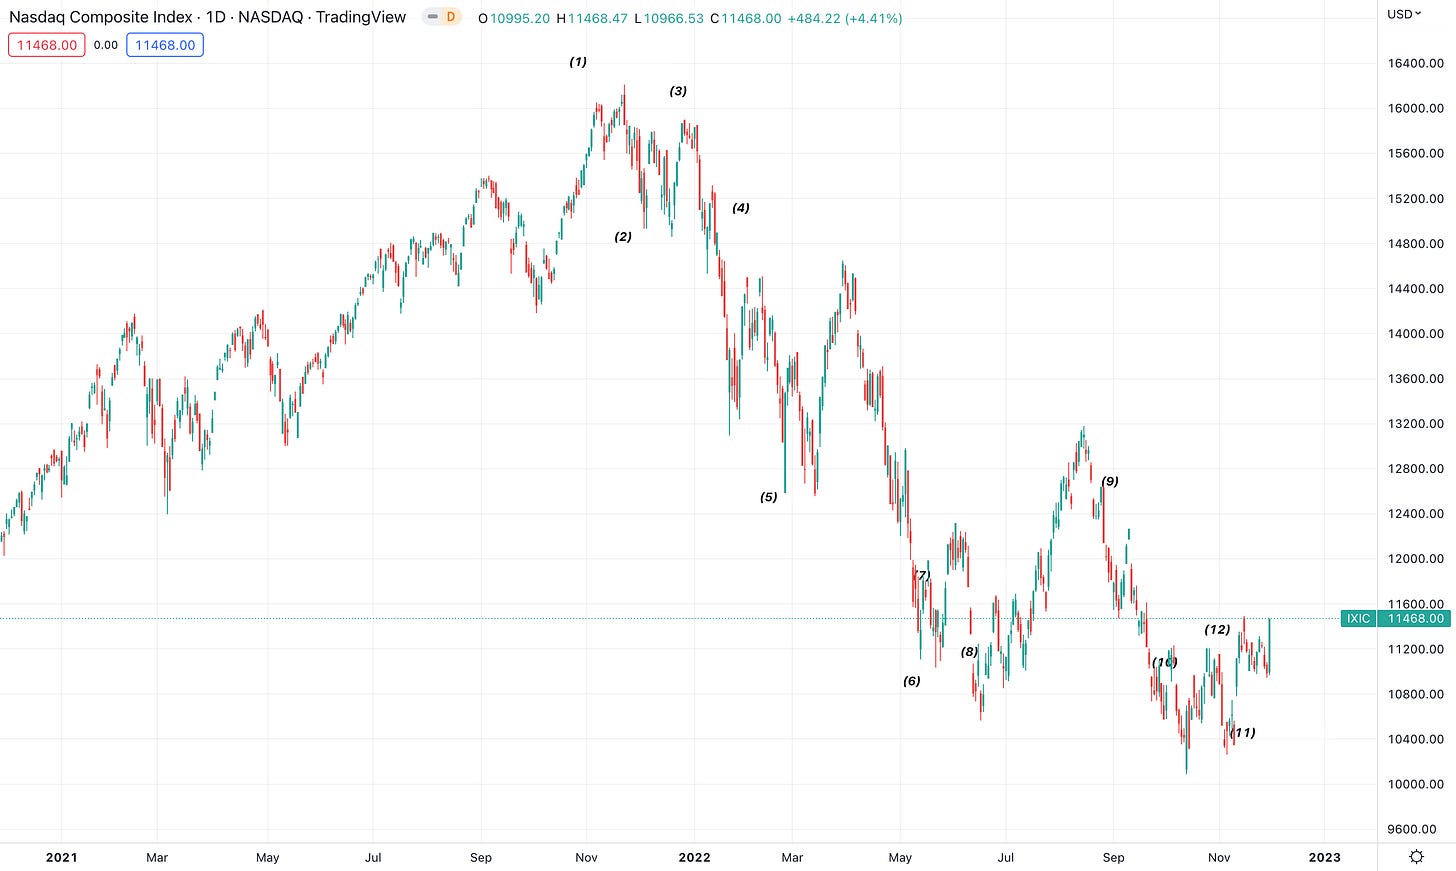
This entire piece will go against the norm/consensus and what we have known for the better part of 2022. Because of this, what I’d like to do is provide additional context on how BluSuit’s Macro focused news letters have done over the past year… Despite not always going with the narrative.
*Disclosure* BluSuit Newsletter is not financial advice, make sure to form your own convictions and thesis about your investments.
1.) The Coming Market Crash - November 10th 2021
2.) The Market Crash - Dec 5th 2021
3.) A 20% Decline in the S&P 500 is Becoming a Scenario - Jan 5th 2022
4.) The NASDAQ is in Trouble - Jan 17th 2022
5.) A Recession is Coming and So is a Large Market Crash - March 6th, 2022
6.) Stock Market Bottom in View - May 21st 2022
7.) The Future Bullish Progression on Fed Policy - May 27th 2022
8.) Positioning for the Next Bull Market - June 26th 2022
9.) Markets Going Lower on Recession Outlook - August 29th, 2022
10.) End of Year Rally in View - October 4th, 2022
11.) The Coming Recession - Nov 1st 2022
12.) All Time High's are Coming - November 13th, 2022
For better perspective, I have labeled all released by their respective numbers. This will be helpful to identify the timing of each release.
When the market looks left, look right and you’ll find opportunity. It’s the corner stone of contrarian…. Excuse me… Intelligent investing. Perhaps, this has been one of the greatest lessons learned of 2022, that nobody truly knows anything and trends are easy to identify. Oh, also, the market cycle is real and the Fed tells us exactly what’s going to happen next. Nothing is ever new, it’s never different this time and often history can be our guide. This is the corner stone of what we post about here to get an idea of how to position ourselves better in the future so as to never experience the same draw down we experienced in 2022, again.
Have I spent the better part of this year fighting the Fed? Absolutely, and it’s with hindsight that I should have trusted my gut (and market calls). But I am/was a “long term investor”, which I still am (for the most part) but I will be more cognizant of the reality that is speculation, greed, fear and noise. Think of it like this, we (BluSuit) are transitioning toward being opportunistic while still maintaining the long term, business first, approach to investing but being incredibly cognizant of the market cycle. This brings me to the point of today’s Substack.
Long Tech, Short Energy
I have sat on this spread for a few weeks now, waiting for it to play out and letting the technical/macro/fundamental picture play out. Now days, I am led to think first and speak later especially when writing about the unpredictable. Believe me when I say this isn’t just a “contrarian” play but it is supported by data, of which will be covered here as I share my thesis. I will outline my thesis in the following format:
Fundamental deterioration/improvement and valuation stagnation
Cyclical and Secular Macro picture
Technical replication of previous market cycles (boom/bust)
The core principle to this thesis is that I am under the impression that we are moving toward a recession.
The list can go on, and on, and on about how/why we are moving toward a recession (an argument can be made it’s already in the pipeline) but the primary reason is the most simple: the 3 month, 10 year yield inversion is signaling it. Notice below that the yield curve inverted every time before a major recession.
This is a Three Part Thesis and No One Aspect Is Enough for Me to Build Conviction. All Three Have to Align.
Fundamentals - Growth Must Come from Somewhere, Just not Commodities
Before we cover the fundamentals of each asset class, we need to highlight a few bullet points. Primarily, understanding the asset class in general. To simplify the below, energy stocks are driven by the boom/bust commodity cycle and secular growth stocks typically carve out a new market.
Don’t mistake cyclical forces for secular forces and don’t dismiss secular forces during periods of cyclicality
One sectors earnings are driven by the price of a commodity, one sector is driven by a secular shift in improving the way we do things.
The core component to the fundamental picture is future earnings and valuation.
Energy’s Deteriorating Picture
A major topic of conversation today is the bifurcation between the price of oil and XLE (Energy ETF). Historically, the price of oil and XLE (energy stocks) trade in tandem. The reason for this is relatively simple, as oil prices rise margins expand for major oil companies like Exxon Mobile (ticker: XOM). You can see the Exxon has been a major beneficiary of higher gas prices at the pump.
As a group, Energy stocks have done extraordinarily well since the bottom of the pandemic. For the past 2 years, they have led the market by a wide margin.
Their market leadership has been a clear beneficiary of two things:
The current market cycle we are in. Typically at the end of a bull market, energy rallies aggressively and eventually sends the economy into a recession. This has happened many times in history, this time wasn’t different. Below, you can see we are moving from stagflation to reflation (more on this in the macro portion).
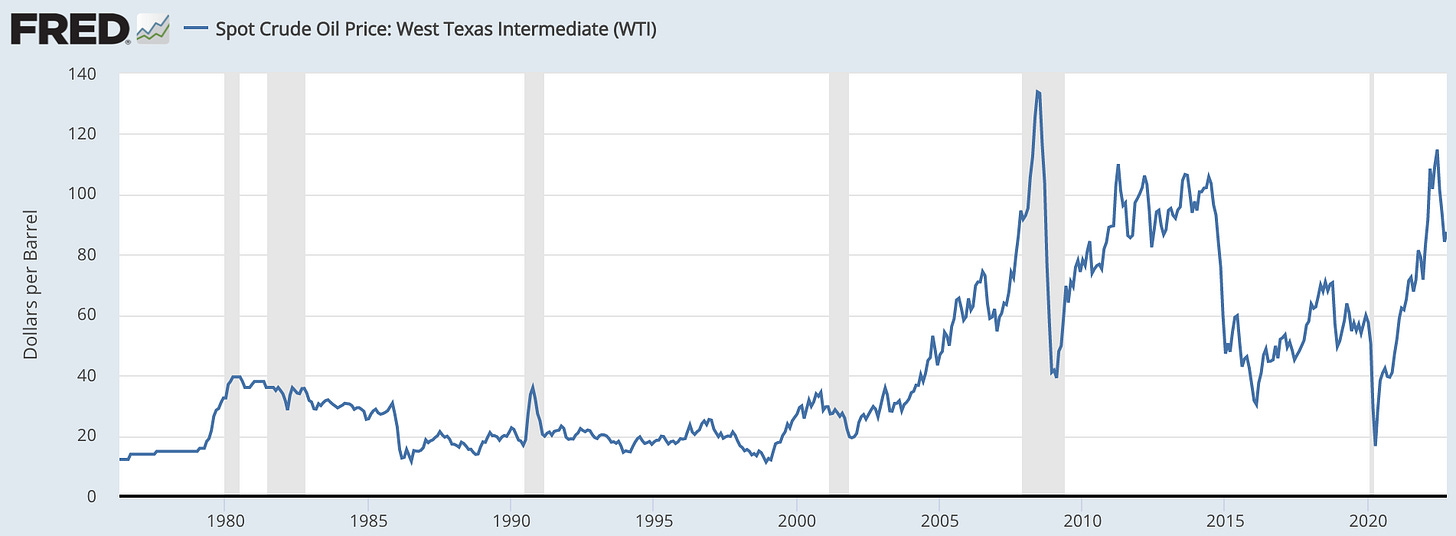
The price of oil sky rocketed. However, the price of oil is exactly the primary case for the deteriorating fundamental picture for XLE. We are currently, roughly, down 40% from all time highs. Yet, XLE is still priced at the same levels as the peak at $124/barrel of oil.
If we assume that the price of oil stays elevated but moderates around 2018 levels, it doesn’t make sense for it to trade at all time highs. Earnings, assuming oil moderates at the 2018 levels, should be less than what’s currently priced in due to compressed margins and low fuel prices (over time) once the price at the pump comes down.
I am making assumptions about today’s price in relation to earnings potential for energy stocks. I am not speculating on what happens in China, Russia/Ukraine and many other global events. Those are narratives. Narratives are more transitory than inflation because they change so frequently and are unpredictable. Instead, I will look at the Federal Reserve and the economic cycle to make predictions.
The price of oil does, historically, come down during recessionary periods.
“But why would oil prices go down and continue to stay down?” More on this in the macro portion of this Substack.
Secular Growth Stocks Continuing Improvement in Top and Bottom Line
The absolute most important thing to understand about growth stocks is the phase of the business cycle that they are in. They typically fall in “the Growth Stage”.
Secular growth stocks are not supposed to be profitable. They are increasing sales, reducing costs through scale and will often see some sort of operating cash flow. This means that, when people say, “growth stocks suck because they are not profitable”. Well, yea, they are not supposed to be profitable because they are following the cycle every other business has followed before them. When a business is growing 30%, 40%, 50%+ they are typically not GAAP profitable.
This brings me to the point that many of the growth stocks that I own and follow have continued to improve their fundamental picture, even the cash flow negative ones. For example, Confluent:
Confluent is just one example, but their latest earnings report continued to show that they were growing exponentially (exceeding expectations) and moved closer to profitability (faster than consensus estimates) while still maintaining a strong cash position. Over time, their trajectory analysts have their scale looking something like this:
I am confidently under the impression that (despite narrative) technology is not going away, is still growing and is the behavior toward this sector is nothing more than investor sentiment related. JaminBall’s Substack provides a great update on where the valuations stand for growth stocks as a bucket. Valuations have made a full round trip to 2016 bear market lows.
I can already hear the bearish narrative “yea but ZIRP and QE gave rise to technology stocks. It’s insane to value stocks based on sales!” My only question, how else are you supposed to price the next SalesForce or Adobe? They are not profitable today but these businesses eventually become profit monsters with scale. These are only two examples.
Salesforce
Adobe
The Main Point in the Fundamental Picture: The Fundamental Future for Secular Growth Stocks Has NOT Changed and Has Only Improved While Commodity Dependent Businesses are Seeing the End to their Cycle
Let me explain more by what I mean that it has improved and has not changed. I don’t own Crowdstrike but I find these to be the perfect example:
Were these good earnings or bad earnings? In my opinion, we have to be real at some point and recognize how impressive it is that a company is managing to grow 50%+ and guiding for 40% growth while heading into a recession! I look back on history and I don’t know of another period in time where businesses where GROWING exponentially, 30%+ YoY, heading into a recession. Snowflake did the same thing on their recent earnings. These businesses are the real deal, regardless of the markets initial over reaction on a slight miss. This is usually algo driven in after hours trading.
The markets response is more indicative of the market cycle than the actual business results, in my opinion. More on that later during the technical portion to my thesis.
The Macroeconomic Cycle and How it Will Impact Each Sector - Energy & Technology
There are a few charts I often talk on:
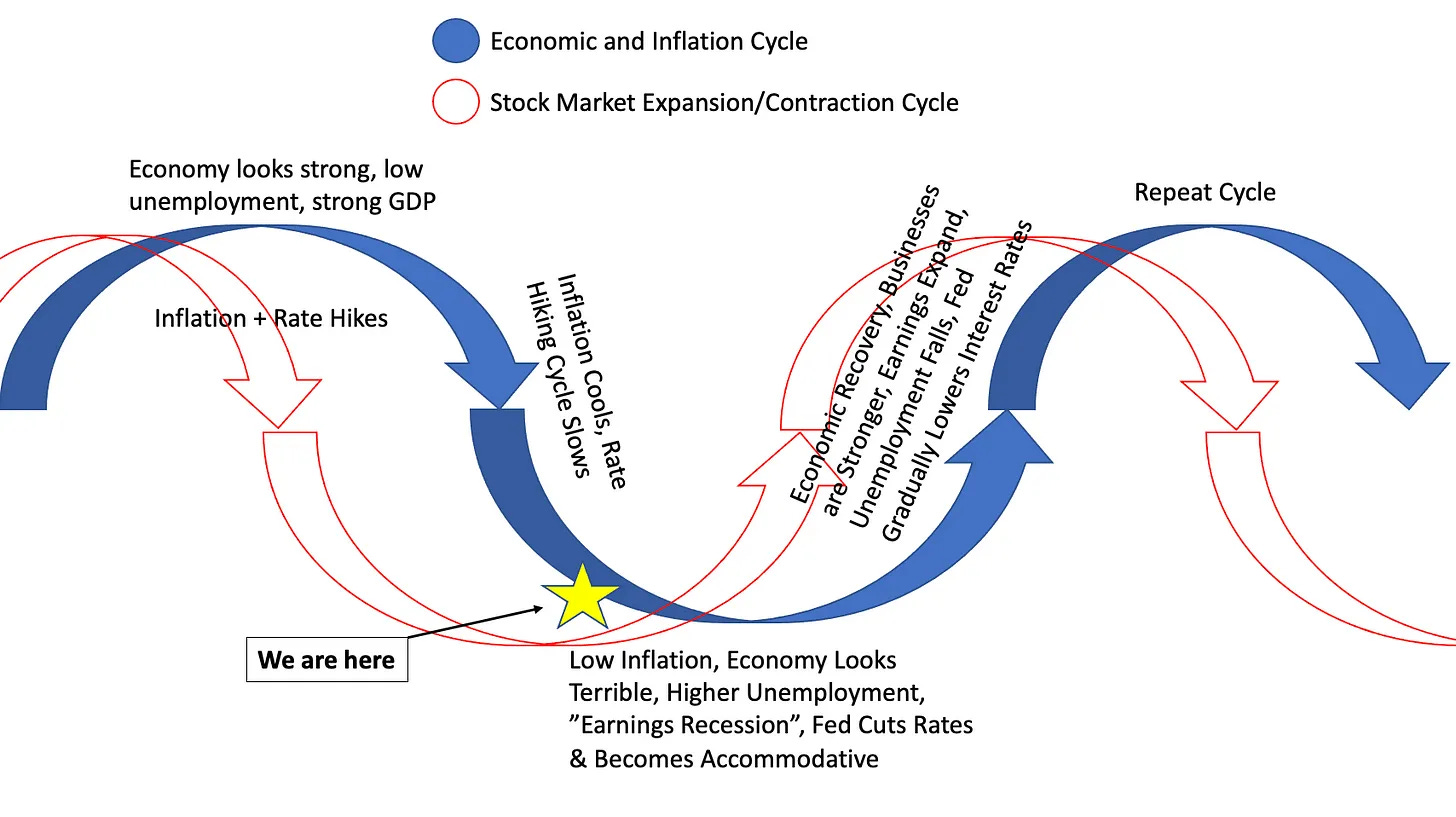
1.) Chart 1 - the economic and stock market cycle and how stocks lead the economy. Note how Financials XLF, utilities XLU, consumer staples XLP and utilities XLU are all trading above their 200 day moving average (way before the S&P) today. TECHNOLOGY AND CONSUMER DISCRETIONARY are the next sectors to benefit from a recovery in the market. Typically, technology gains the most of its momentum during an economic expansionary phase.
2.) Chart 2 - Sector performance during phases of the inflationary cycle. We are in between stagflation and reflation (closer to stagflation). Bonds, staples and financials are the sectors likely to benefit today.
3.) Chart 3 - How I see the macro economic picture & Fed policy progression.
Explaining the “Why” We are Here - Inflation
Inflation marked the end to this recent business cycle and the end to the bull market as we knew it, that began in 2009. Inflation has historically always been a catalyst to every major market crash in history, the reason why: the business cycle, as depicted above by the cycle charts I shared. Oil, or Energy stocks, historically always follow this pattern. I don’t have access to data that goes too far back, but we can see the correlation below:
CPI Rising and Economic Recessions: Recessions = Bear Markets
Historically Oil Moves with CPI - Oil is Inflationary
A Bet Against Oil is a Bet Against Inflation and A Bet for a Recession
On a macro perspective, the price of oil historically always comes down during recessionary periods. The rationale behind this is relatively simple, everything requires energy.
Vacations
Business travel
Home heating
Entertainment venues
Business offices, etc.
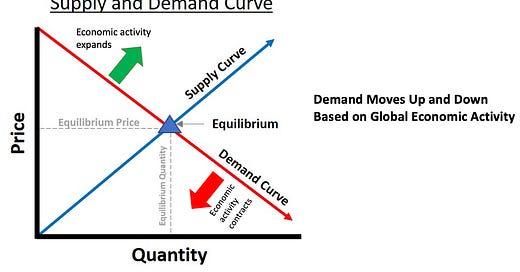
The best way to think about the demand for oil on a macro level is correlating it with the global economic output. The faster the economy is growing, the higher the demand for energy. The visa versa is also true, the slower the economy is growing, the lower the global demand for oil is. It doesn’t matter if there’s a short supply if demand lowers, a new equilibrium is met.
Today, not only do we have an adjustment to the demand side to the equation but the U.S. is increasing it’s oil output alongside Venezuela, Russia (selling to China/India) and OPEC.

Lower energy prices are coming both from supply increasing while demand is falling, which will create lower oil prices. This leads me to the final portion of my thesis. Remember, it’s not just one piece to this thesis that convinces me this spread will outperform.
Technicals: The Tech Bubble has Fully Deflated and the Energy Bubble is Here
During every thesis I develop from a Macro/Fundamental perspective, I have learned to read/trust what the charts are saying to time correctly. My thesis on any trade doesn’t matter if the broader market doesn’t see it, which is the purpose of reading/understanding charts. In addition, we also have to see where the broader market is over bought or over sold, or where there’s patterns that are showing area’s off accumulation or distribution.
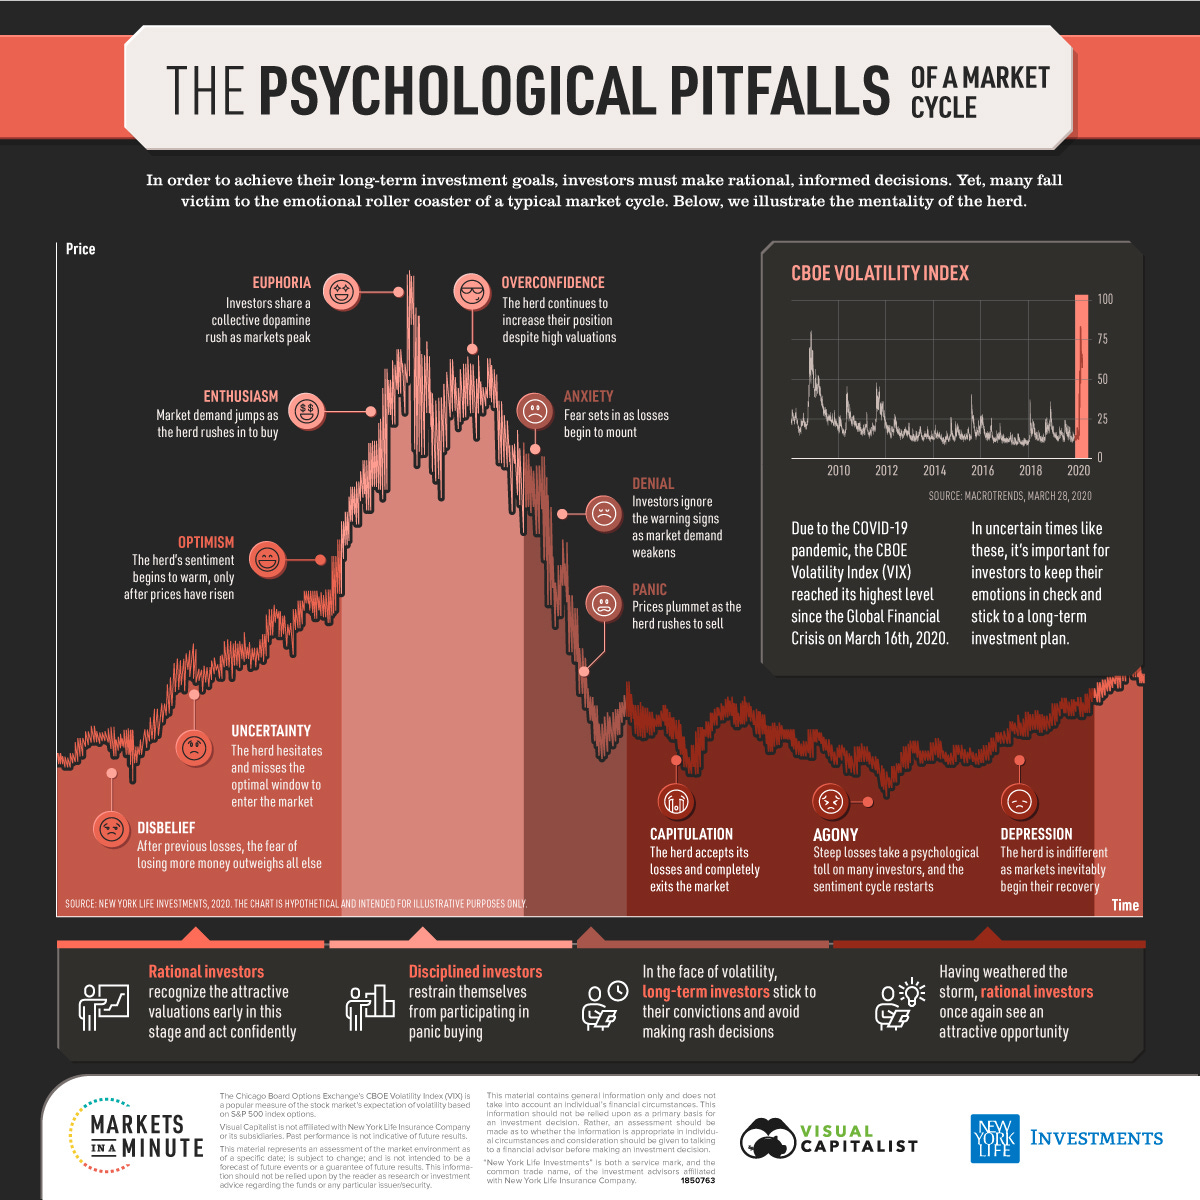
It was in my study of previous market bubbles that I came across similar technical patterns that must display the phases of human emotion. Below was a chart I came across that I found to be the most interesting.
The phases from Disbelief to Euphoria, to Capitulation and Agony, these phases have repeated throughout history. Arguably, two of the most famous are the Japanese Nikkei Bubble in the 1980’s:
And, the 1999.com bubble in the U.S.:
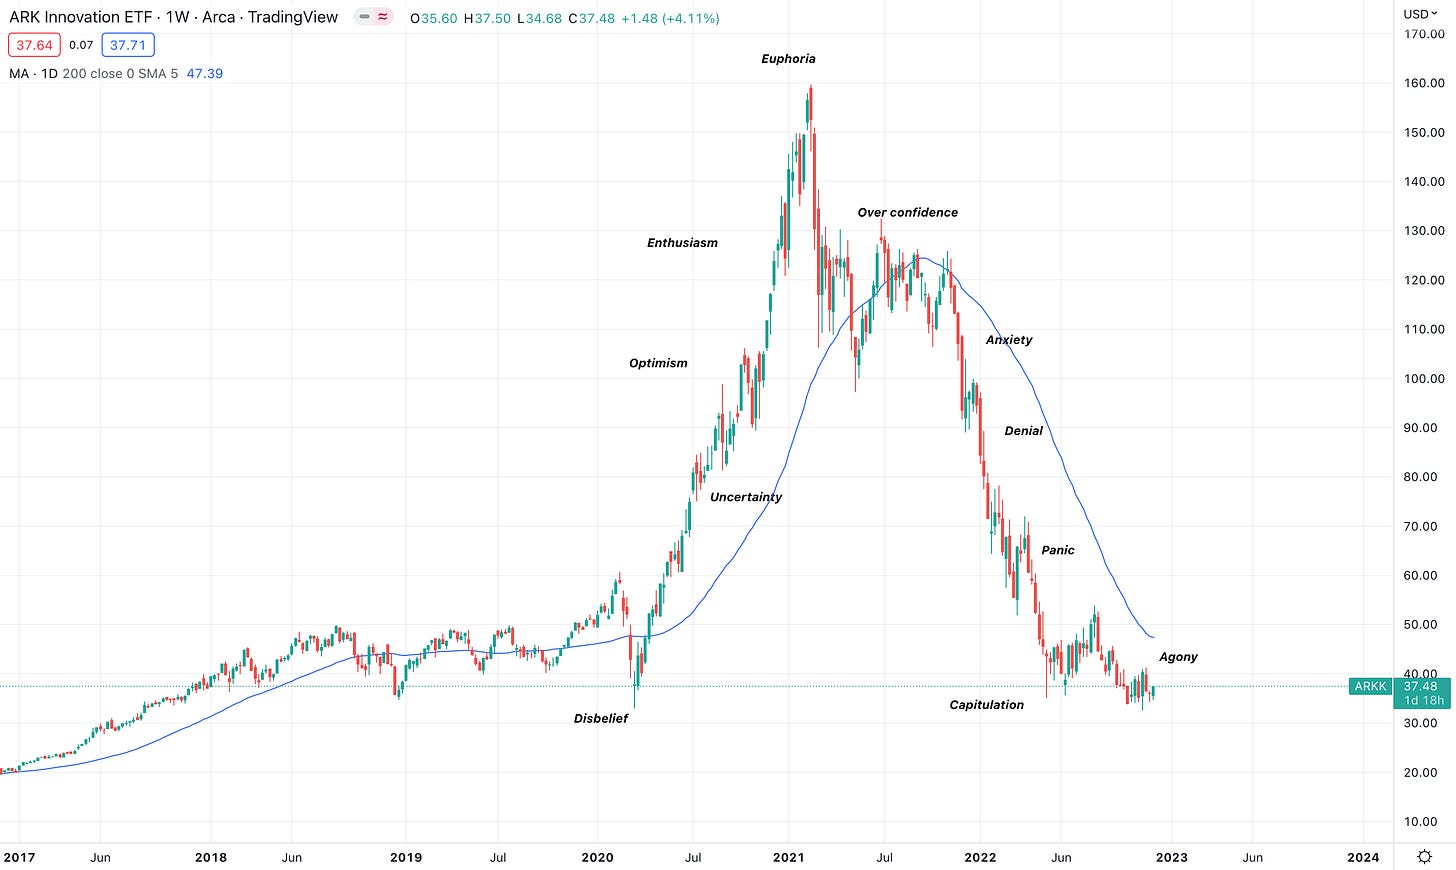
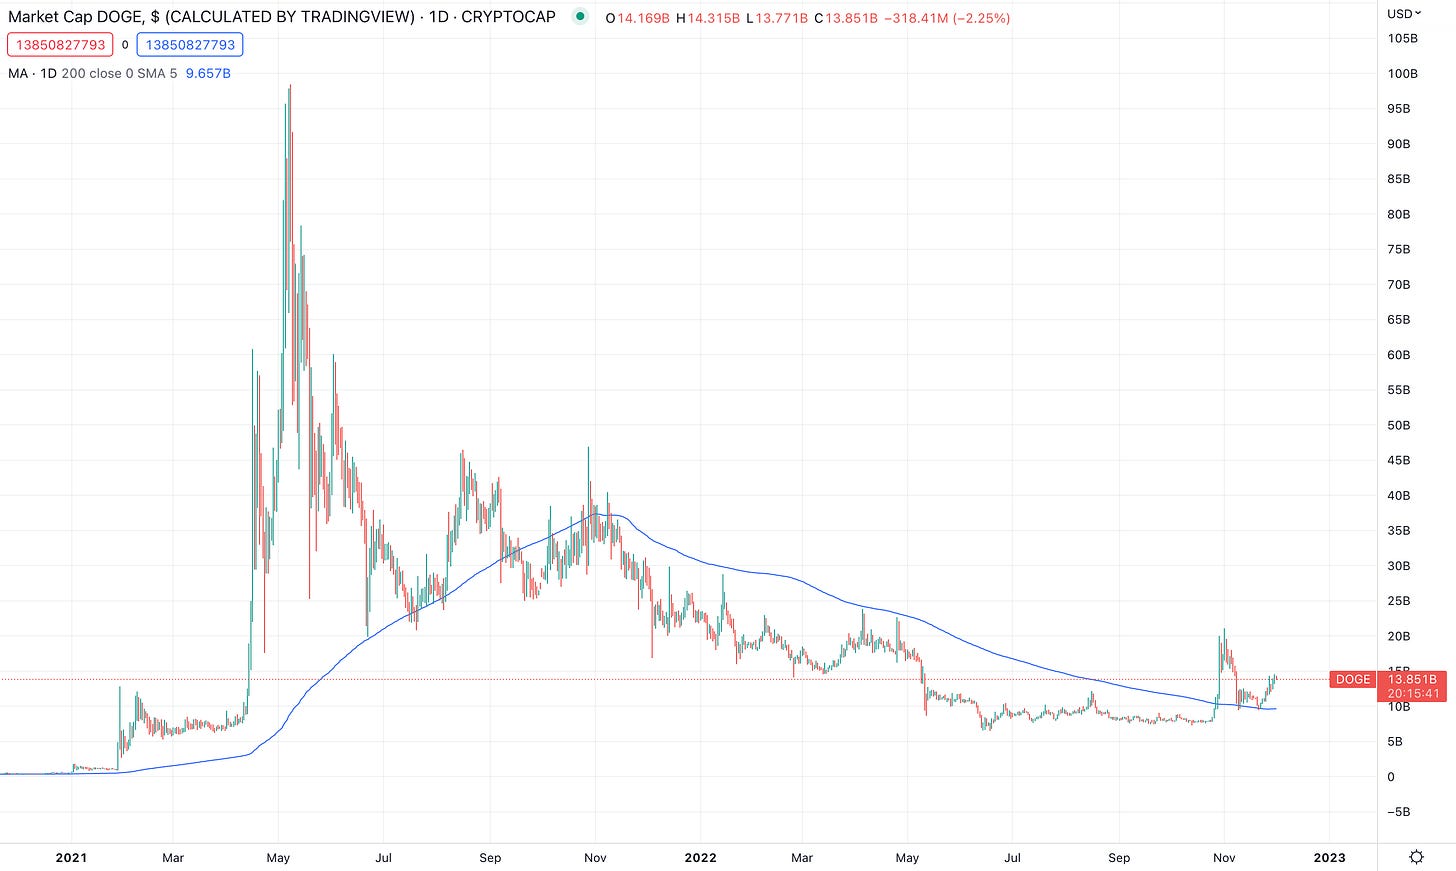
What I am trying to show you, the reader, is that these phases are relatively predictable. It appears that it is sentiment (and liquidity) that is driving these market cycles in the individual sectors. Recently, in the United States, the bubble that we recently experienced was not in the major index’s. It was beneath the markets. It was in both Crypto and Innovation stocks.
I am under the impression that ARKK’s bubble phases were shorter lived than the 2000 - 2002 NASDAQ because the rise and bust was relatively quick and predominately fueled by Fed policy. The euphoria, in my opinion, was a by-product of a Fed fueled liquidity bubble. We also saw this in Crypto:
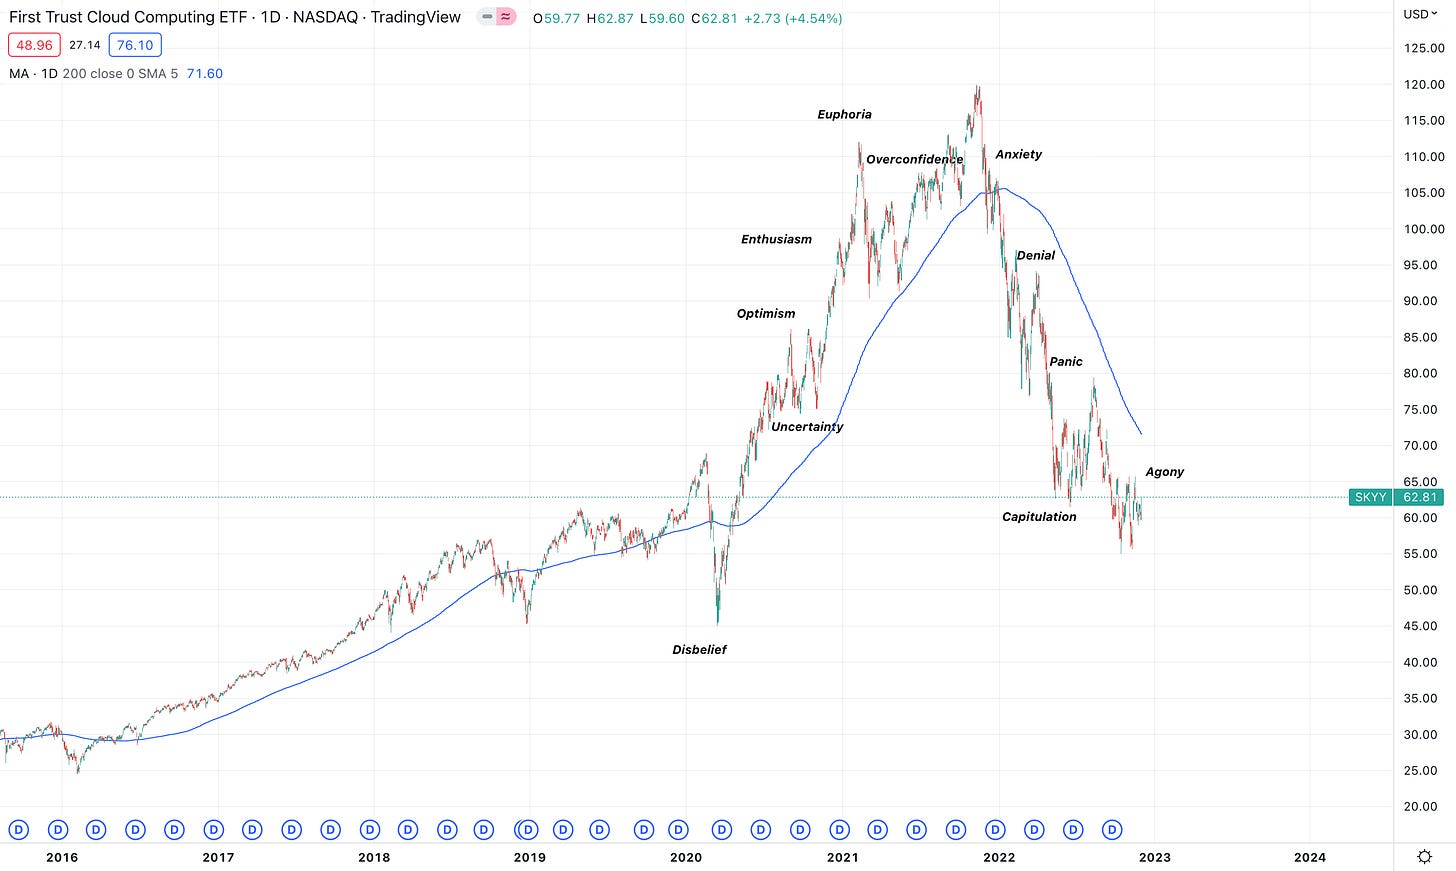
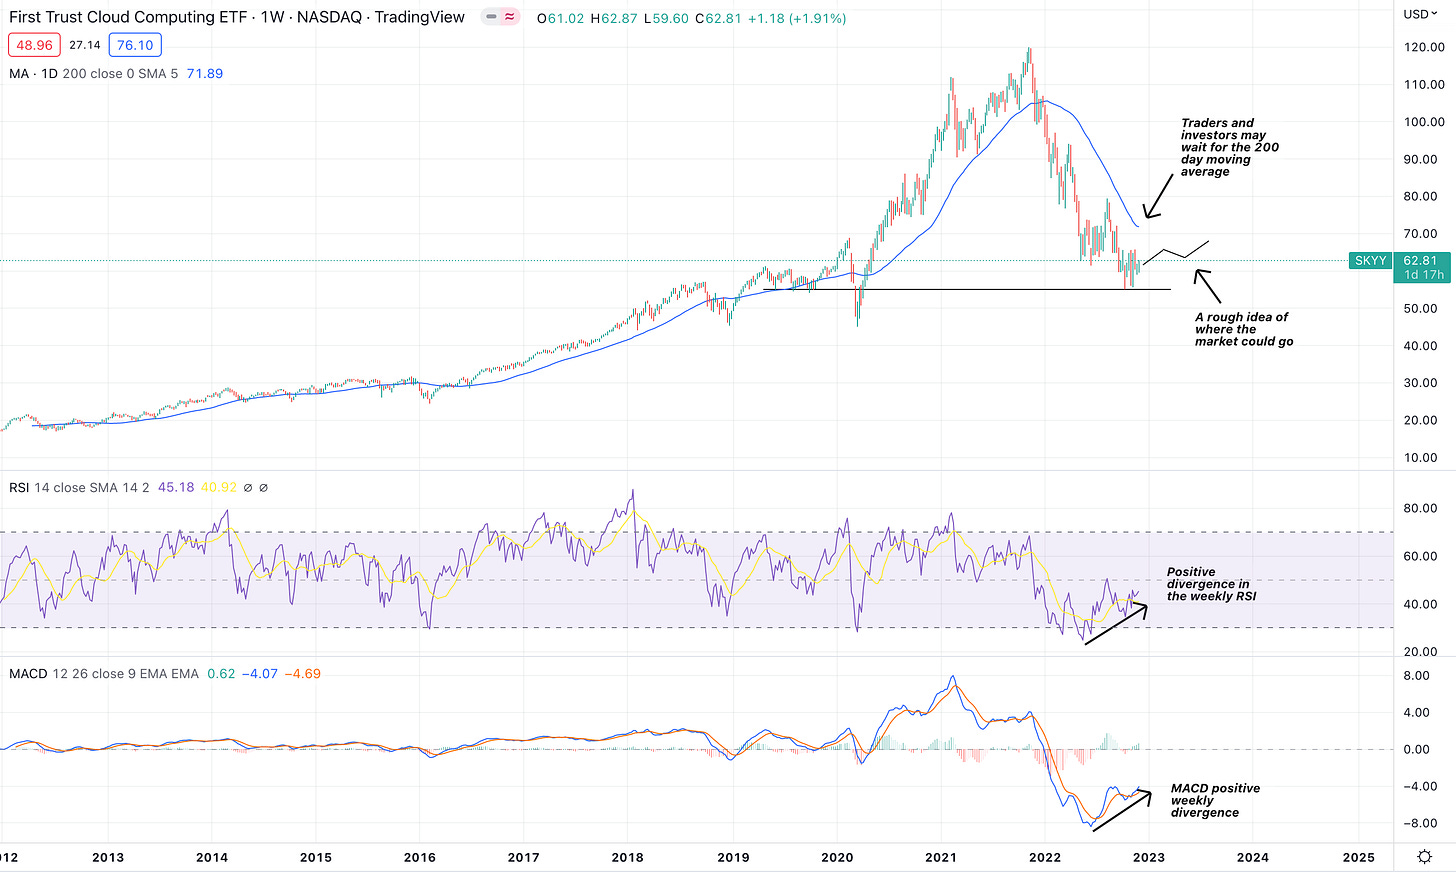
More importantly in this bubble analysis, for many who follow this SubStack, we tend to be more oriented toward quality growth stocks. By quality I mean businesses with strong/improving cash flows, strong balance sheet and growing revenue with a durable moat. They are productive assets with improving bottom line fundamentals. These stocks still found themselves in a bubble as well. I use SKYY (Cloud) ETF to gauge the market I am participating in. Of course, what we experienced was a bubble too.
You may not necessarily agree with where I placed the phases of the bubble’s and you may believe that we still have yet to see capitulation. This is ok and I fully accept that I can be wrong in my analysis of the phases. In this latest market bubble, it really was different in the sense that it was the Fed that drove the bubble rather than investor sentiment. The Federal Reserve, when it was printing $120b/month, produced the EXACT market reactions in the tech market. But now, I believe that the current market froth (not necessarily a full bubble) is in Energy rather than technology.
Technical Indicators in Technology and Energy
Technology, although not driven by ZIRP and QE, the secular fundamentals are still there and this is most indicative by the improving fundamental picture in the secular growth stocks like Crowdstrike and Snowflake. The macro picture here is the secular macro force that is the transformation of digital business, rather than cyclical Fed fueled force. The technicals (below) also are suggesting an accumulation phase is taking place now as the RSI and MACD are showing positive divergence while SKYY has traded sideways since May of this year 2022.
Energy stocks, on the other hand, are showing strong negative divergences with a deteriorating macro picture along with a detachment from fundamentals. In 2022, Energy has been the only sector that has performed this year (+64%) compared to all major indices reaching bear market levels. Usually the same sector does not out perform 2 years in a row and Energy has performed extremely well in 2021 & 2022. Couple the lagging technical picture and the deteriorating fundamental/macro outlook. It would appear like it’s time for, at the very least, a solid pull back in energy stocks.
I think it’s a good thing to clarify that I don’t necessarily believe energy is going to $0 but I do believe it is over valued from today’s levels and the technical, macro and fundamental perspective. I have a reasonable price target of $60 - $70 on this short idea.
Energy is obviously needed in everything we do and for that reason, Oil isn’t going away. However, I do see that energy is detached from its fundamentals currently with a slight hint of speculation and over confidence. For this reason, I believe there is 20% upside from today’s (December 1st) prices in the growth stock market and 20% downside in the energy market over the coming months.
If You Enjoy My Analysis
BluSuit is now a free publication and will be for the foreseeable future. Consider subscribing to our future newsletters.
Stay Tuned, Stay Classy
Dillon











Hi Dhillon, I don't agree with the all time high's coming. I do think we will get a 15-20% run up from current low's but this will lead to the next leg down. We are heading into for a recession and no one can predict how bad this will be.
I believe the market does not reflect earnings recession.
Oil will stay high, I do believe OPEC will cut production, and when we recover, oil may spike on demand and potential stimulus from governments.
10/10 analysis, completely agree. Most commodities/energy have rolled exactly for the cyclical reasons you state + recession. CB by design must stay overly hawkish until the backward looking data equals target inflation, markets will move before. Biggest threat to this thesis is a very cold Euro winter. Biggest upside is an early resolution in Ukraine (investors unaware of the solid progress made here).