

Long Term Investing is Dead
Let's start in 2004, after the NASDAQ Bubble and Before the GFC

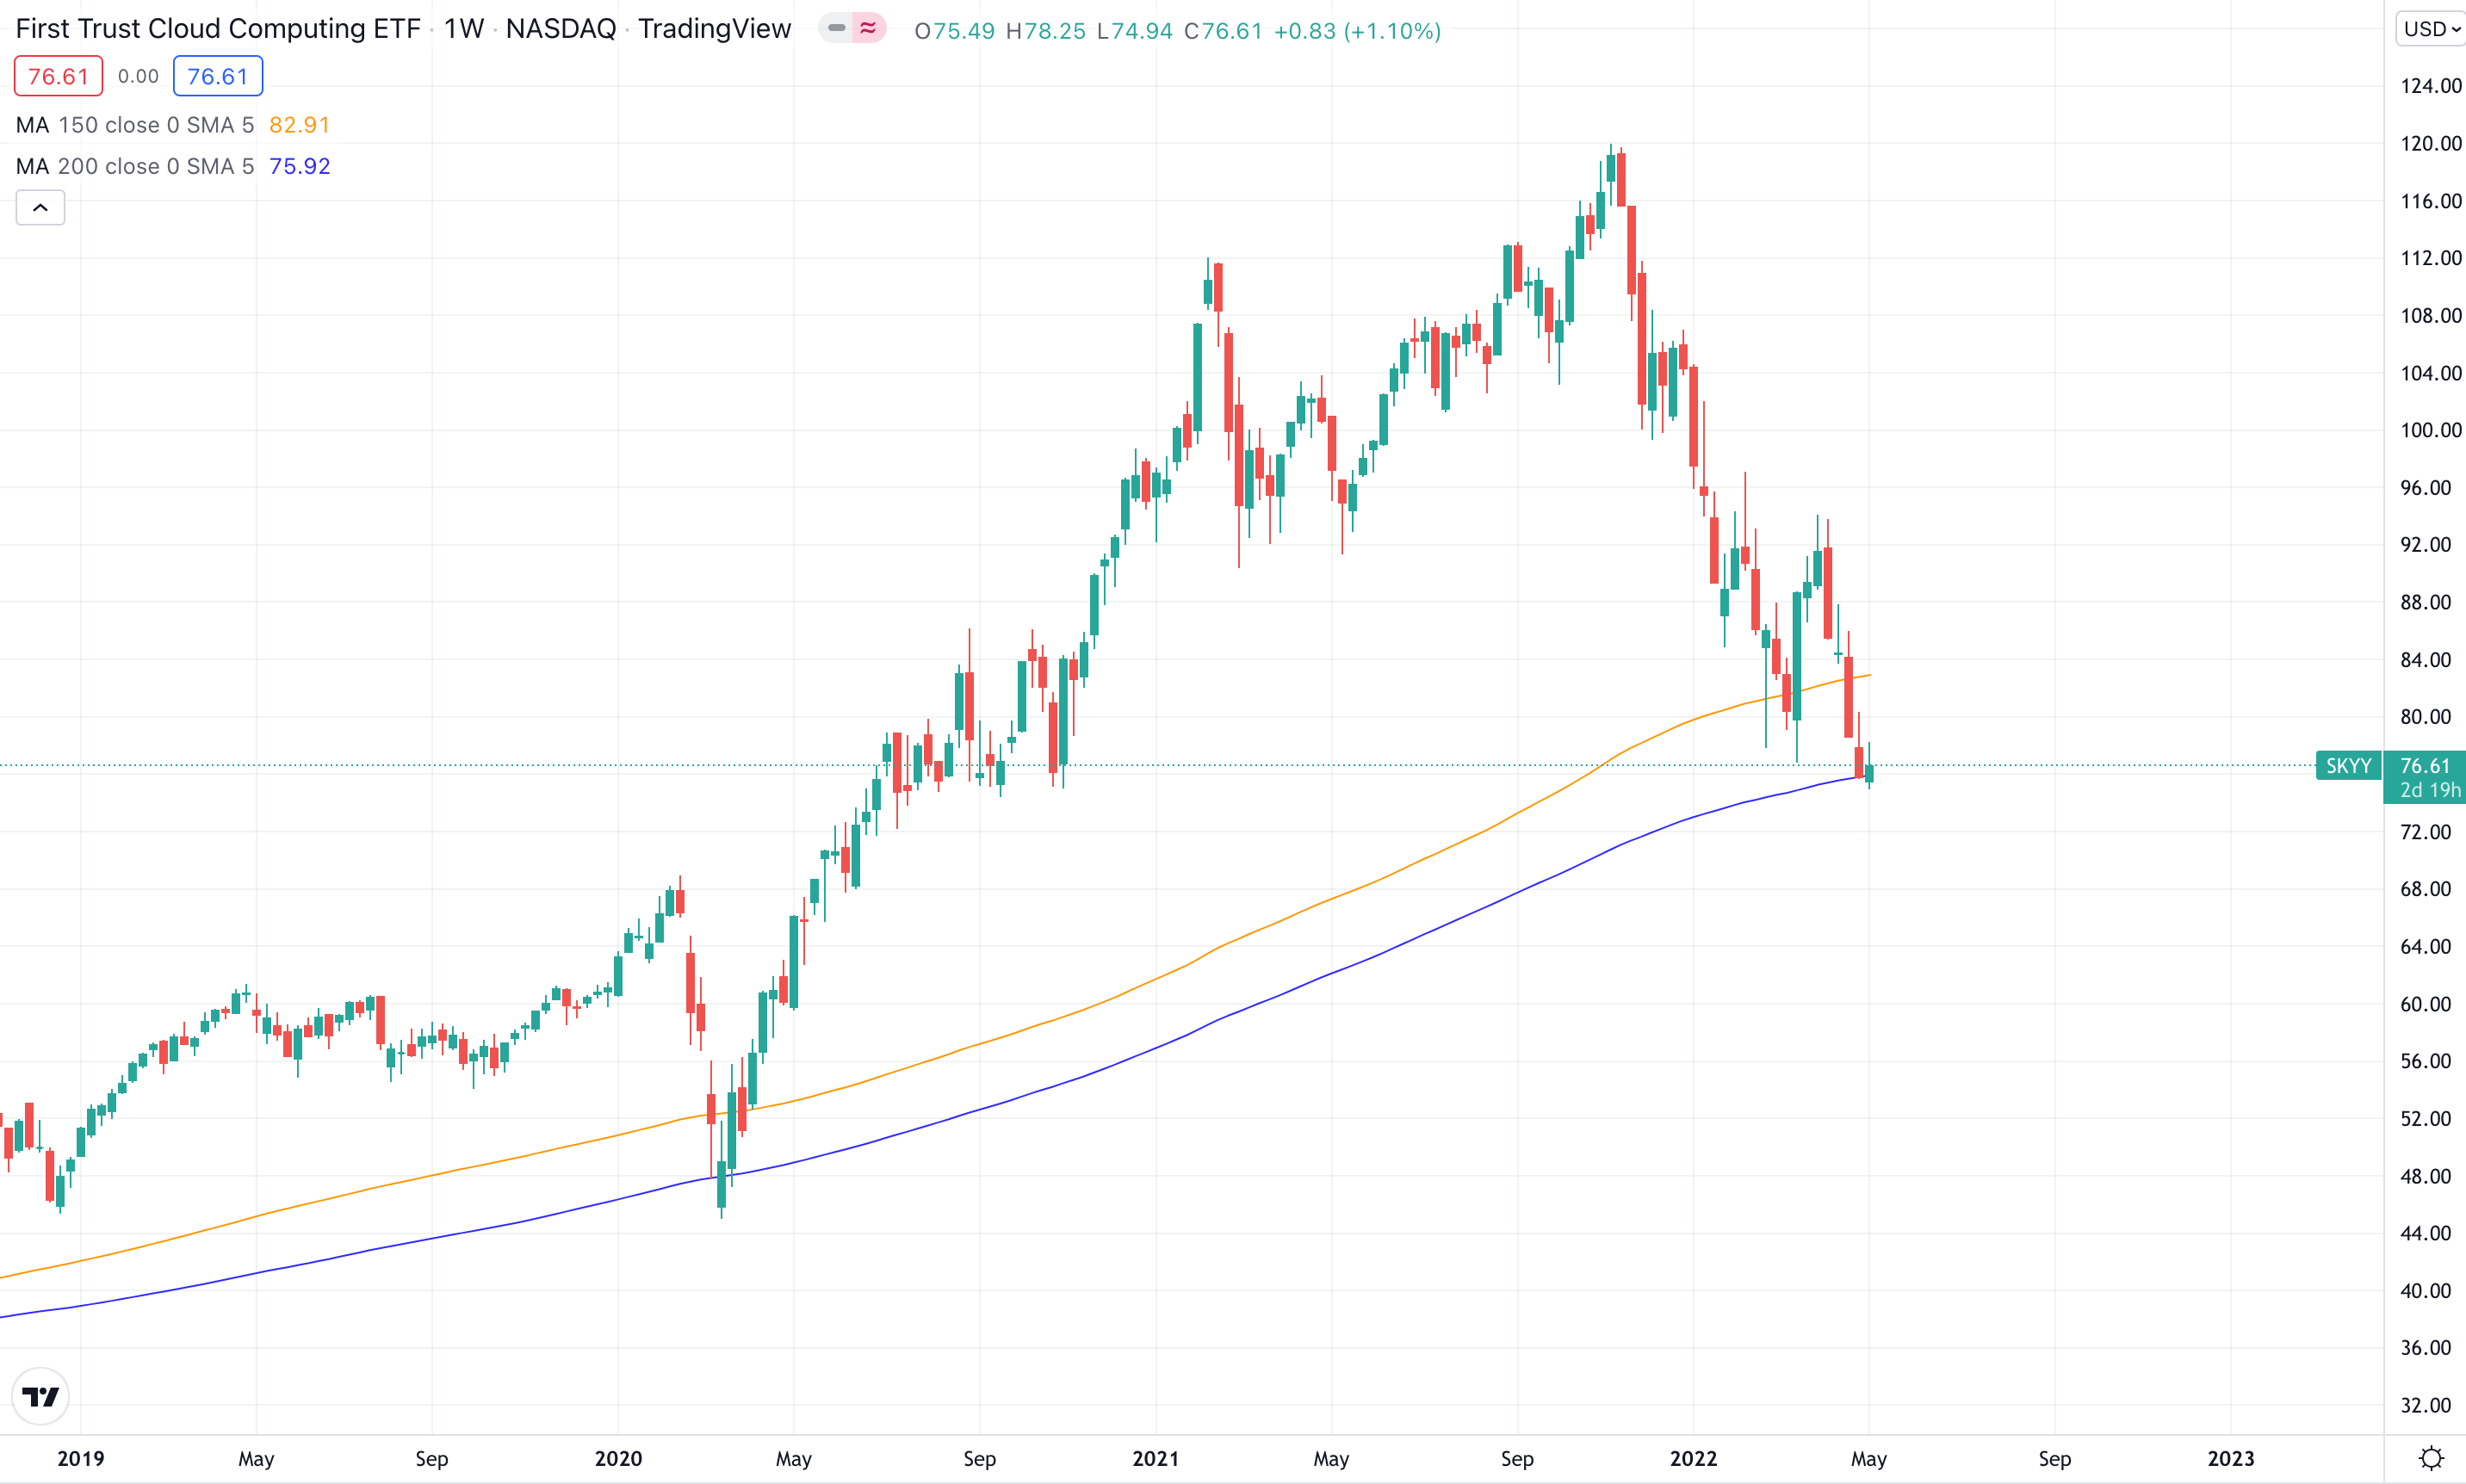
Human nature is arguably one of the strongest forces within the stock market. It’s the one thing that doesn’t change. What I am talking about specifically here is, how much investors focus on the downside to the point of completely ignoring opportunity. At least, after a bubble they do. The thing to understand is that we have seen carnage beneath the surface of the indices comparable to the 1999 NASDAQ bubble collapse. This is most reflective in ARKK or SKYY (software ETF).

I know what some people may thinking, especially if they didn’t live right through it or just bought index funds. It may be common place to assume, “Cathie owns garbage companies”, or “it’s your fault if you owned expensive tech stocks”. But, this isn’t just focused on only “wood stocks” or “technology”, it was basically all small and mid cap businesses that experienced this devastation. This is most reflective in the bifurcation of small and mid caps vs large caps in the S&P index’s. We can see the multiple compression, which is larger and longer than the 2008 decline, here:

The point I am trying to make here is that we witnessed a major boom, and bust, beneath the surface of the major indices and only stock pickers have truly felt the carnage. This brings me to the title of this publication, “Long Term Investing is Dead”… Or so it seems.

To Get a Rough Idea of the Carnage, and Situation, we have Experienced, we Have to Look back at 2004 and Start There.
Daily, we are inundated by short term thinking and fear as well as disbelief in the idea of buying and holding companies for the long term. Results are measured YTD, by months or by weeks. But in the case of economic activity in America or general business growth, rarely true progress is made in a matter of months but in years. In many scenarios people think you are smart or stupid on a daily basis and it fluctuates with the price action. This is laughable and doesn’t make much sense.
What I am trying to say is that, if the idea of the stock market is to invest into businesses, why are we measuring ourselves on monthly or quarterly performance? Not that much changes on a quarterly basis. Progress is really reflective over years, rather than months. That means we have to define, with ourselves, if we are trading or investing. Are we trying to pull money from the markets or trying to create generational wealth?
Let’s run a scenario and ask can we out perform the markets?
Ideally, Peter Lynch ended up saying that if you can pick a good business 60% of the time, you’re doing tremendous. We are going to use this as a staple for our example. In addition, for variability sake, we’re going to also assume we can pick a good business 40% of the time. Of the 60% of the businesses that work out, we must be realistic and know that 1 of those may turn into a mega winner like Tesla, Apple, SalesForce, Adobe, Amazon, Google, Apple, or many many others.
The idea of this scenario is to start in 2003/2004 with a $10,000 account. We are going to distribute $1,000 into 10 different positions. Each stock we buy will be a growth stock, not a value stock, that was considered a “speculative investment” in the mid 2000’s post 1999.com bubble implosion. Imagine investing into a tech company during this time and what “The Heard” was telling you. But the idea was to buy a business with growing revenue, earnings and cash flow.
The S&P 500 returns since 2004 are roughly 265%, or a 7.42% CAGR. With the $10,000 portfolio, if we only have 1 mega winner, would we out perform?
Let’s take a look at a few of the mega winners, what their price was in 2004 and their respective declines in 2008/09.
Salesforce: IPO’d at $3.22 on a split adjusted basis and declined 70% in 2008/09. Imagine how garbage this company would be in FinTwit’s eyes today.

$1,000 would have bought roughly 310 shares @ $3.22. Today, those shares are now worth $178 even after a 50% decline. $1,000 is now $55,279, which is about a 25% CAGR. If we consider the $10,000 portfolio and the other 9 positions go completely to $0, you would still yield a 10% CAGR. This would beat the market and out perform most fund managers. During the recession, they continued to grow revenue, earnings and cash flow. I found a press release from 2009 when the share price was $9/share and was 50% off ATH’s.

MercadoLibre IPO’d in 2007 at $29/share and declined from $80/share to $8/share in 2008. Absolute garbage company, right? It would be in FinTwit’s perspective.

$1,000 at IPO in Mercado Libre would have given you approximately 35 shares @ $29/share. Today, those shares are worth approximately $1,000/share even after a 50% decline. This would now have this position worth $35,000, or a 27% CAGR on the position today. If you imagined your $10,000 portfolio having all 9 positions going to $0 and only MercadoLibre yielding any return. Your CAGR would be 8.7%, beating the markets. In early 2009, below, you can see they were consistently growing revenue, earnings and cash flow despite economic headwinds. Their share price was $12/share at the end of 2008.

Apple started crushing it in 2005, after declining $1.33 to $.25 on a split adjusted basis in 2000 - 2003. In this case, we are going to stay consistent and buy $1,000 of Apple stock in 2004 and declined 61% during the GFC.

Apples chart is pretty crazy, I feel compelled to show you how aggressively this thing fell off a cliff in 2000.

In 2004, the share price on a split adjusted basis was approximately $.40. This would allow us to accumulate approximately 2,500 shares. Today, the shares are worth $160. The position would have grown from $1,000 to $400,000 or a 39.5% CAGR. If you had apple in your $10,000 portfolio and all your other investments would have went to $0, you would have yielded a 23% CAGR. What’s interesting is that, in those days, they were simply selling Mac computers. I am sure Wall Street just thought that they were a “over valued computer company”. That’s the thing about bears, they are always negative and fail to see the bigger picture. But still, I pulled this up from 2008 to show them still growing revenue, earnings and cash flows. After all, we can start to see a trend here?

Amazon was thought to be another “bust” of a company after the entire market left it for dead. But you’ll see, it kept growing revenue, earnings and cash flow. It declined 95% once in 2000 - 2003 then declined again 65% from 2007 - 2009.

With $1,000, we would have had enough to buy approximately 22 shares. Today, each share is worth $2,500/share which means that the position would have grown to $55,500, or a 25% CAGR. If we assumed all 9 of our other investments went to $0 in our $10,000 portfolio, we would still yield a 10% CAGR since 2004, beating the markets. Back in 2008, Amazon still managed to find a way to grow during a severe recession and they managed to grow revenue and cash flow in Q4 2008.

I Could Continue With Many Different Examples but Let’s Get to the Point
There are many other companies that declined substantially during 2008 and investors panicked, selling their entire positions and never got back into the market. They took their losses, went home and gave up. At the bottom, many were convinced long term investing was dead and that the only way to do this is to macro trade. This leads me to my point, you didn’t need to time the market and you didn’t need to be right 100% of the time. It’s insane to think that one stock can lead you to years of stock market out performance but it can.
In regards to our $10,000 portfolio, let’s go back to our 60% and 40% rule. Remember when I mentioned above that Peter Lynch said you’re doing exceptional if you do well on 60% of the stocks you pick. Odds are likely, if you invest into growth stocks, that you will eventually find one or two big winners. So, let’s assume that with our $10k portfolio that we have just one of these big winners, going up thousands of %, and a few decent stock gains with approximately 500% - 600% since 2004 and we’ll just say we flat out lost a portion.
In our 60% success portfolio, we start with $10,000 in 2004
1 stock is Amazon, gaining 5,467%
3 stocks gained 500% - 700%
2 stocks gained 200% - 300%
4 stocks we lost all our money in
It would look like:
$1,000 $AMZN → $55,500
3 stocks roughly at 600% → $18,000
2 stocks roughly at 250% → $5,000
4 stocks now at $0
Total portfolio now worth $78,000 or a 12% CAGR, beating the markets.
In our 40% success portfolio, we start with $10,000 in 2004
Much like above, we will adjust this to be:
1 stock is Salesforce, gaining 5,434%
2 stocks gained 500% - 700%
1 stocks gained 200% - 300%
6 stocks we lost all our money in
It would look like:
$CRM → $55,279
2 stocks roughly at 600% → $12,000
1 stock roughly 250% → $2,500
6 stocks go to $0.
Total portfolio is now is roughly $70,000, yielding $11.4% CAGR, beating the markets.
This Game is About Focusing on Revenue, Earnings and Cash Flow, not Always Being Right
There are many different things we can do to move numbers around and I made this extremely simple. There are many ways we could have lost more money, or made more money than we originally thought. For example, doubling down on your winners during a bear market (like what I have been doing) and increasing your odds of having 2,3, or 4 stocks that are 10 baggers. Or, averaging down on a losing company that could lead to a few more thousand(s) lost.
The major point is that you don’t need to be an exceptional trader to out perform the markets. You don’t need to time anything or worry about the collapse of a financial system. Sometimes, it really is as easy as buying companies with growing cash flow, revenue and earnings. Sometimes it’s about staying focused on your winners, developing a thesis, cutting your losers, avoiding bad companies, believing in revenue growth, cash flow and earnings, and paying attention to the strength of the balance sheet during turbulent times.
Human emotion is what makes this difficult and the herd makes it even harder. We are inundated with financial news about everything we “should” care about and in some cases, we should care about it. For example, if you owned bank stocks during the GFC you should probably reconsider your position because the regulatory procedures that followed bank stock investments led to years of under performance. Or, if there’s a secular shift within the macroeconomic environment that could favor, or disfavor, your investments long term. There are facts and there are speculations.
There is no other job on this planet that is allowed to be so wrong, so frequently, as an economist.
BluSuit is Dedicated to Sharing the Findings on Stocks with Growing Revenue, Earnings, and Cashflows
Lately, I haven’t seen many stocks that are catching my eye that fit this investment philosophy outside my core stocks. I have been focused on accumulating these businesses. You can find my investments and track my decisions here:
I opened my portfolio, all my decision making and stock picks DURING a bear market when my investment philosophy is completely out of favor. The reason why I did this, I am confident and have a strategy. I welcome you to follow along.
Buy and Hold Isn’t Dead. It Never was and Never has Been.
The only thing that’s died is patience, discipline, and a welcoming of delayed gratification over instant gratification. Investor sentiment is more transitory than inflation (see what I did there?) and market cycles do exist. Only in the stock market are investors willing to buy stocks that have rallied hundreds of percent in a year, when it’s extremely expensive, than buying when it’s on sale or a discount.
Think of Real Estate, Banana’s/Apple’s at the super market, vehicles, gold, or really anything. When it’s cheap, investors flood to buy goods/services but never stocks. By understanding that stocks only move up over time when they grow revenue, earnings or cash flows and that there’s an intrinsic value assigned to the underlying productive asset. Risk, in this sense, is not defined in terms of volatility but defined in in terms of permanent loss, or failure to pick the right businesses.
Stay Tuned, Stay Classy
Dillon
Good breakdown. A lot of value here!