
Mid Week Memo
Mid Week Memo
The beginning of a new series and a new bull market

I love what I do and love having the opportunity to share my investment journey with all of you. To expand on what I already do with my portfolio updates, which is a more in depth weekly research piece, I wanted to announce that on a weekly basis in between Tuesday - Thursday (in the middle of the week) you can expect a short memo.

The purpose of these are to, in a concise way, provide an update of what I am seeing out there in the markets and share perspective on the emerging data of the week. For today’s Newsletter, I have three important data points to talk about:
Technical picture on the NASDAQ
Macro update and what the inflation data means for the markets
A new stock I bought this week and why
The Technical Picture Looks Very Bullish
Technicals are important. In many ways, it’s the data point that shows you what institutions are doing and the momentum behind the markets. In the short term, it offers you a strong picture behind where there may be areas of supply in demand within specific markets as well. The way I look at it, the longer the trend the stronger it is.
On a daily basis with the NASDAQ there are a few key details
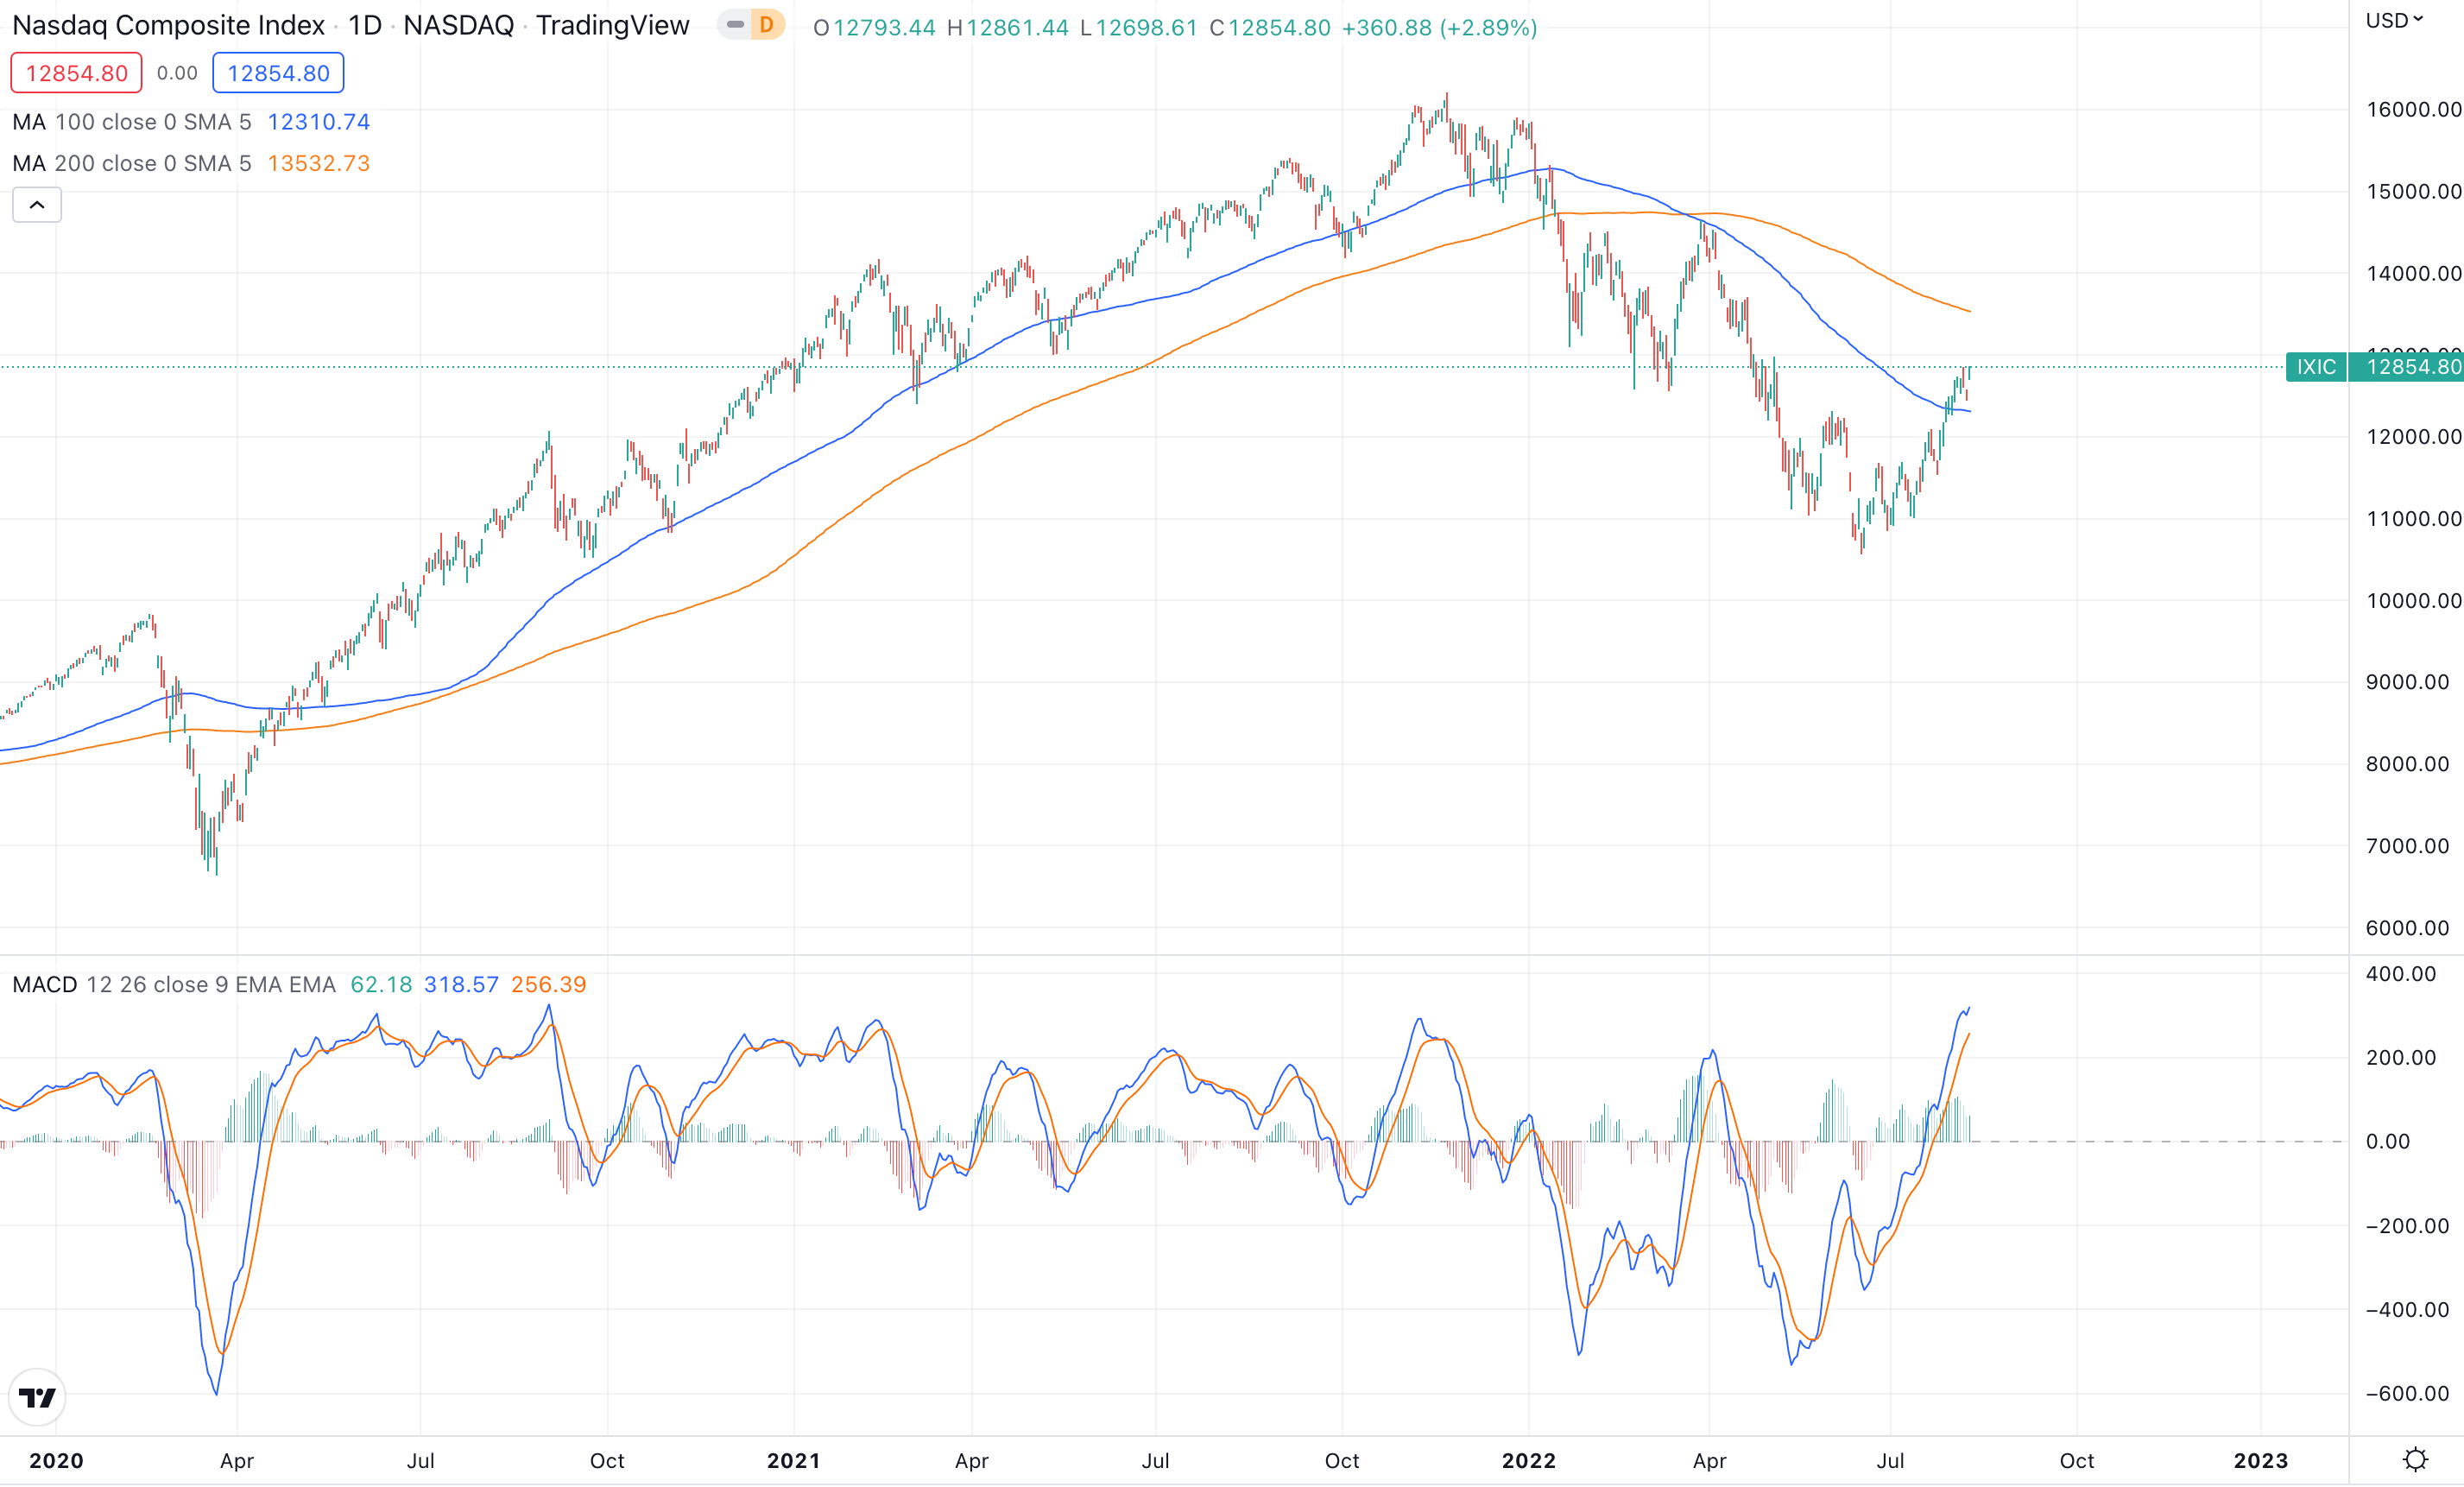
We recaptured the 100 day moving average which acted as the topping point to the March “bull market rally”. Going above this marker can give us more certainty in this rally as, looking back on a historical basis, trend lines that act as resistance usually keep acting as resistance in a down trending market.
We seem destined to meet the 200 day moving average. There seems to be a common narrative out there that you shouldn’t add until the markets recapture the 200 day moving average in the markets, this doesn’t make much sense to me. Unless you liquidated your portfolio in December, this yielded really no true results. Arguably, you missed on the best buying opportunities of many stocks. For example, DLO 0.00%↑ fell down to $14/$15 in this bear market only to rally 100% off the lows. Good businesses are good investments. Obviously I speak from as an investor.
On a weekly basis, the trend is more structural in nature
I barely look at the daily charts when it comes to the index’s except to identify the major moving averages. The weekly chart is 5x more structural and reliable. Especially when you think about the longer term trends and areas of support in the markets during bear markets. Look at how the 200 week moving average has acted as support for the past three bear markets..
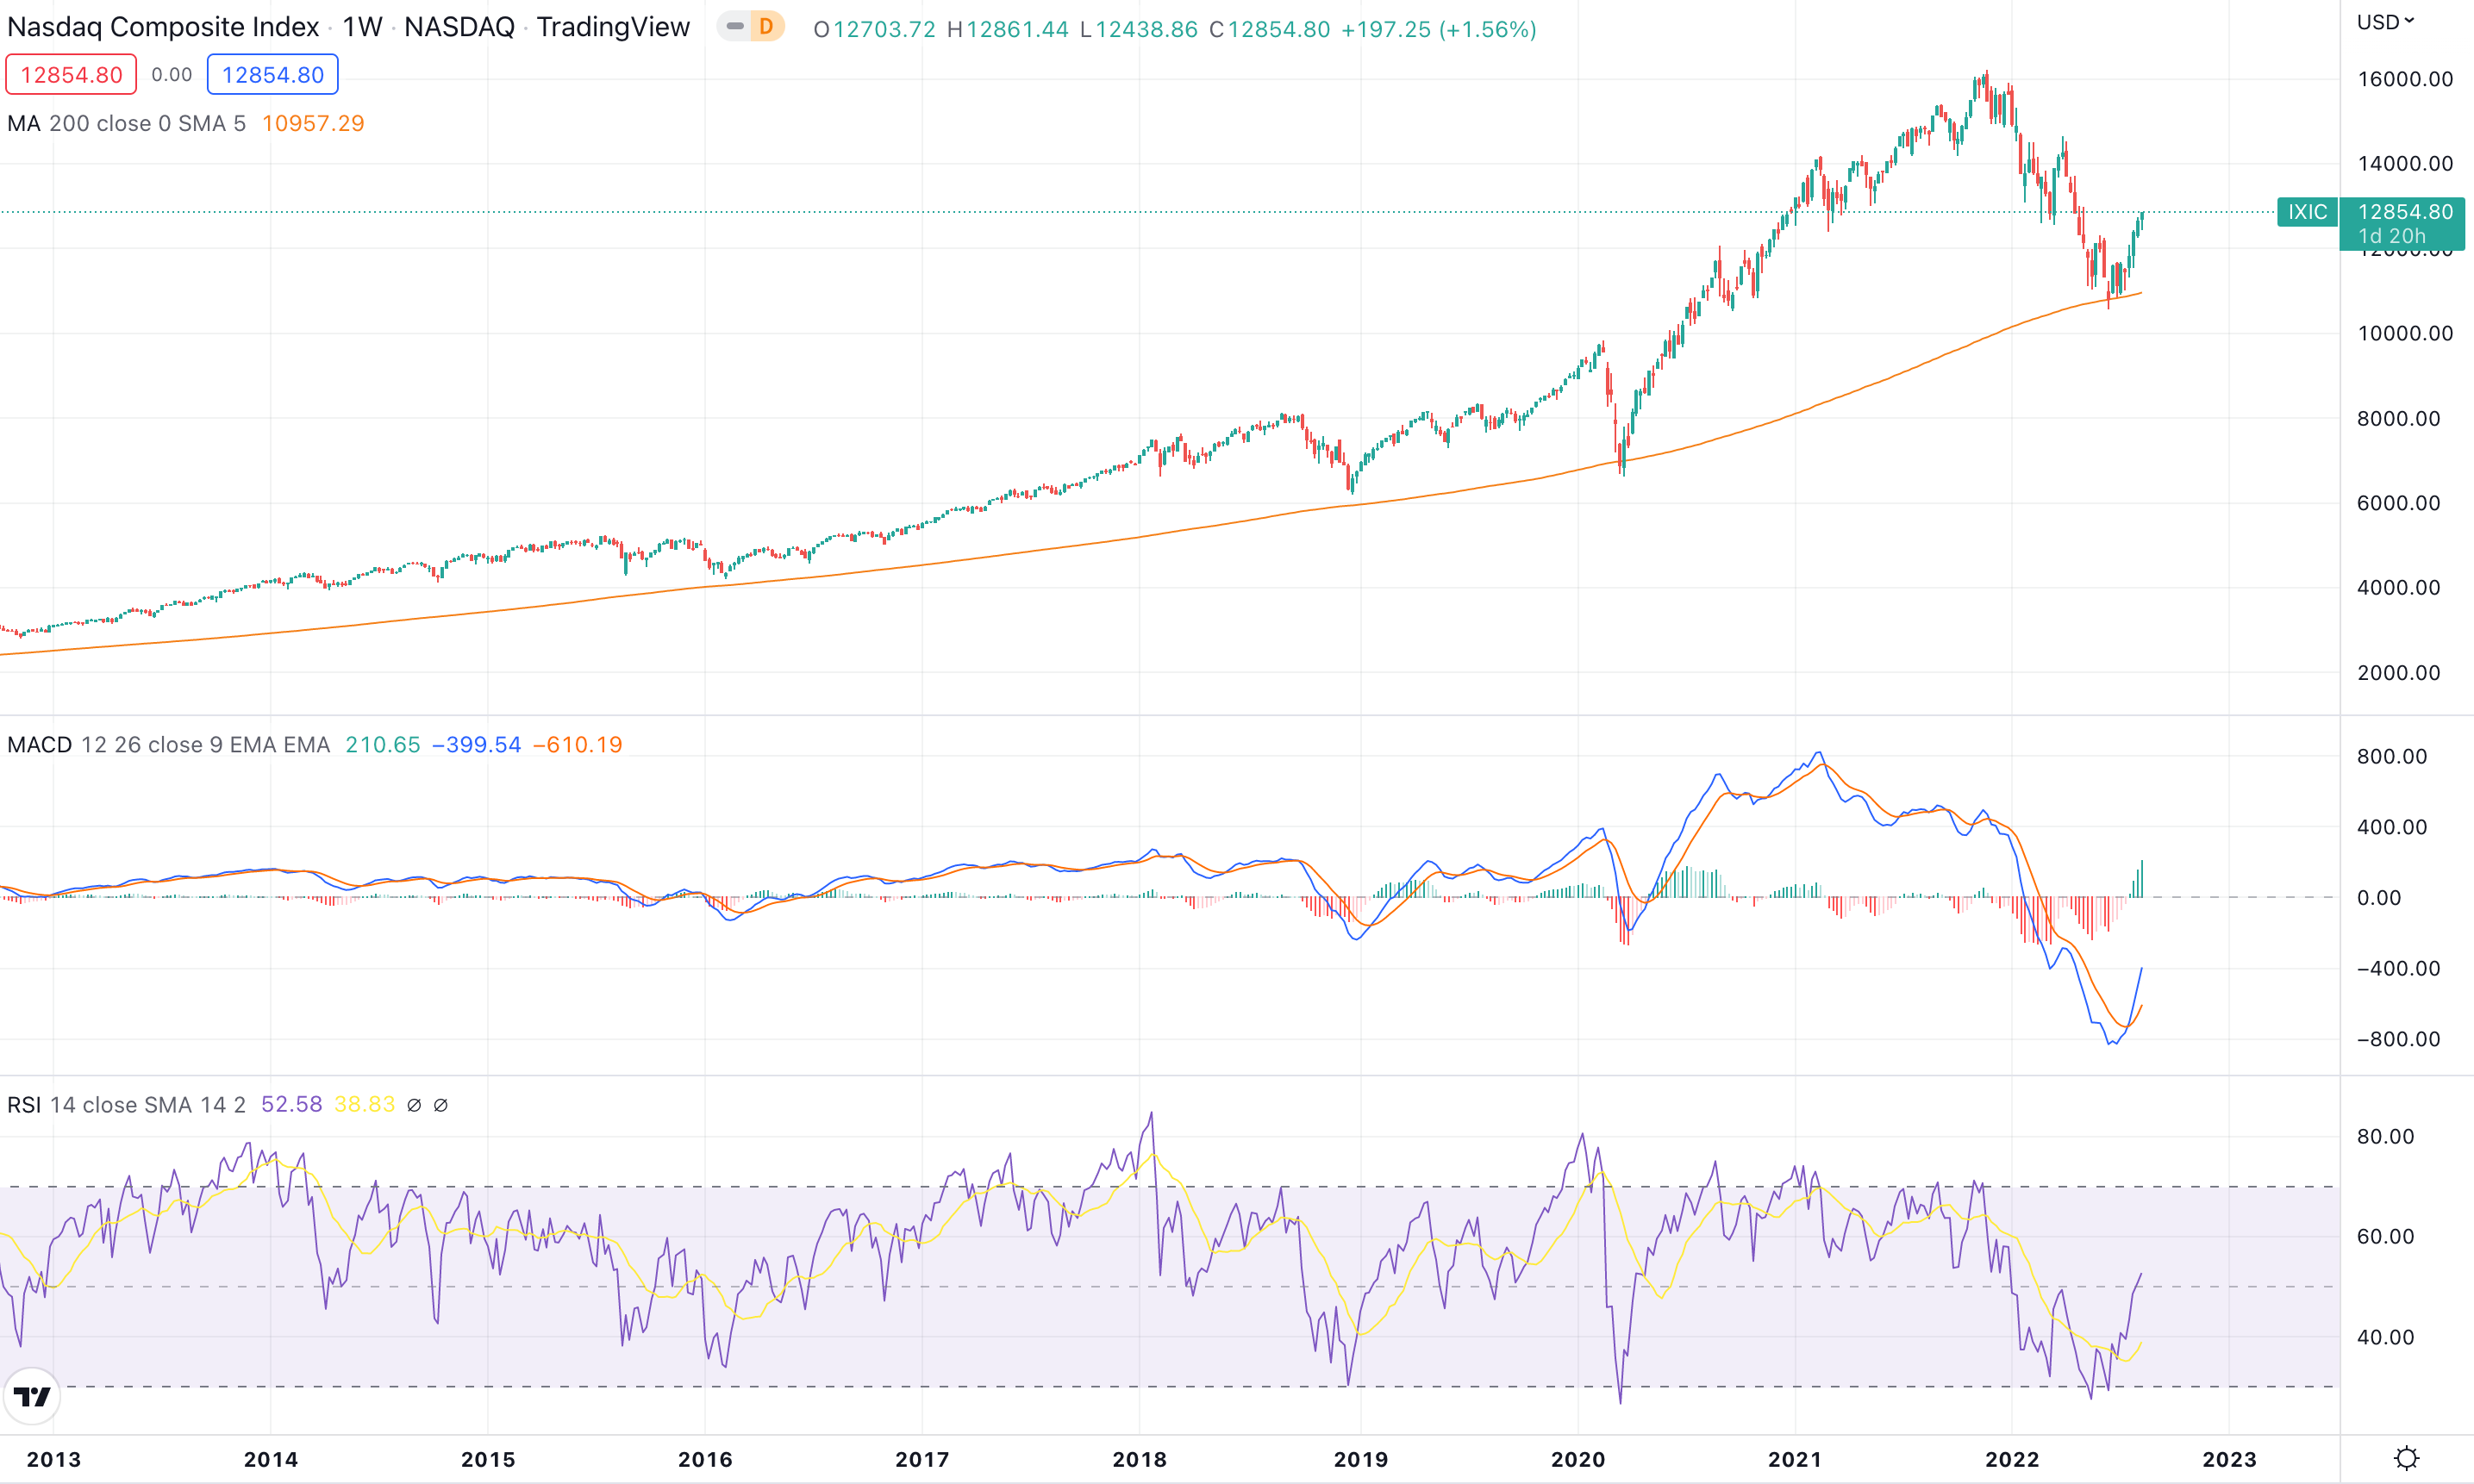
The MACD is curling up. This tells us the trend on a weekly basis in the markets. We can often use this indicator in relation to the RSI, which tells us if a market is oversold/overbought. If you see the MACD curling downward and we are over bought on a weekly basis, this could signal danger ahead. The same is true on reverse. In the case of today’s markets, the MACD trend reversal coupled with the RSI being relatively neutral (50) tells us that we are still positioned for another 1-2 months of this rally. This doesn’t mean that we wont see red days in between. This means that we can expect our portfolio to finish up on a weekly basis especially for this week.
The bounce off the 200 week moving average is text book to a cyclical bear market in an ongoing secular bull market. The major area of support tells us that we hit some extremely over sold levels. History tells us that, in an ongoing secular bull market, it’s never a bad idea to add at the 200 week moving average despite the bearish news flow.
Just looking at the technicals, I’d say we are primed to rally back to all time highs. Yep, I said it, we are rallying to all time highs. Everything is signaling that we, at the very least, will make an attempt to retest all time highs. Coupling these indicators with Macro, it becomes even more bullish.
The Macro Picture Continues to Improve
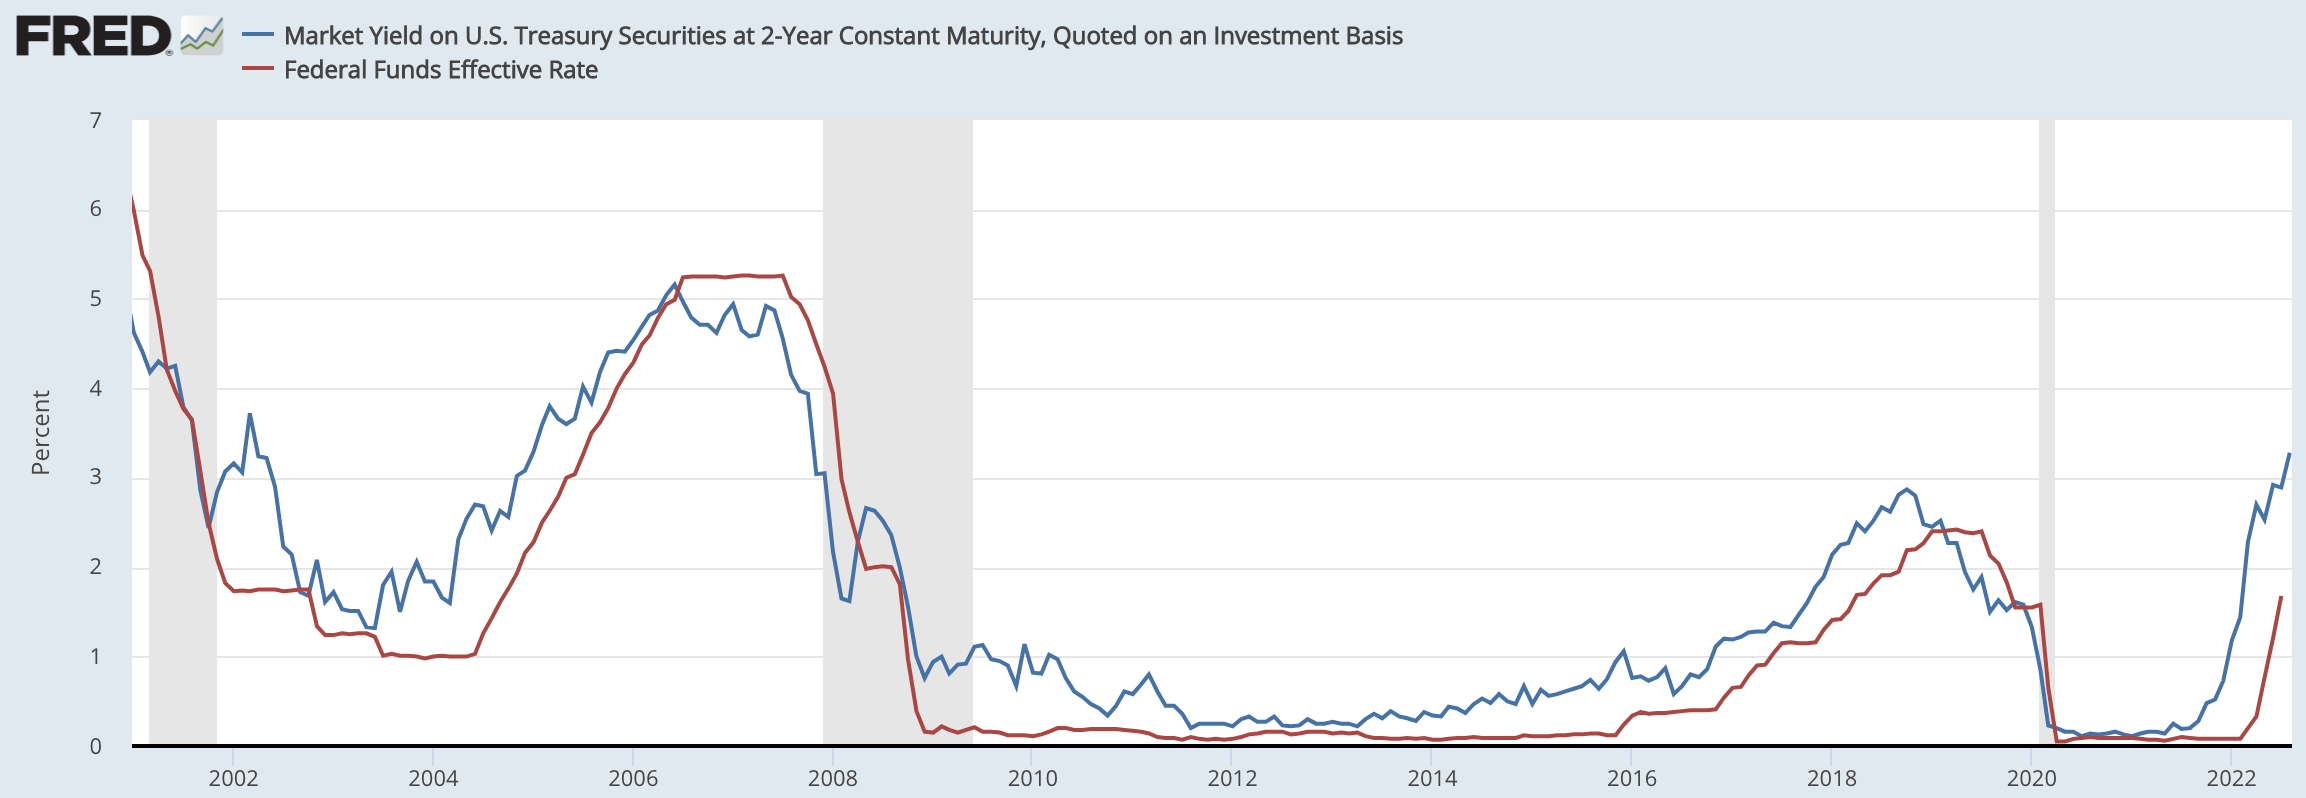
I have mentioned since the bottom of the NASDAQ that I believe we are at market bottom because I believed that markets priced in peak rate hike expectations. It’s the expectations of the market that did a majority of the Fed tightening already. On a historical basis, this is most apparent in the 2 year yield and the Federal Funds rate. You can see that the 2 year yield is roughly 6 months ahead of the Federal Funds rate (which is the official interest rate set by the Fed). This is due to a key tool the fed has, their credibility. Meaning they can talk rates up and down before they do anything.
CPI Coming in Cool Today Was a Game Changer
Bull markets climb a wall of worry. For the better half of this year, we experienced one bad piece of news after the other for a solid 6 months. The result was one of the worst starts to a stock market in history on any given calendar year. But finally, today, we had a breadth of fresh air. This is something we are not used to. Inflation actually came down BELOW expectations.
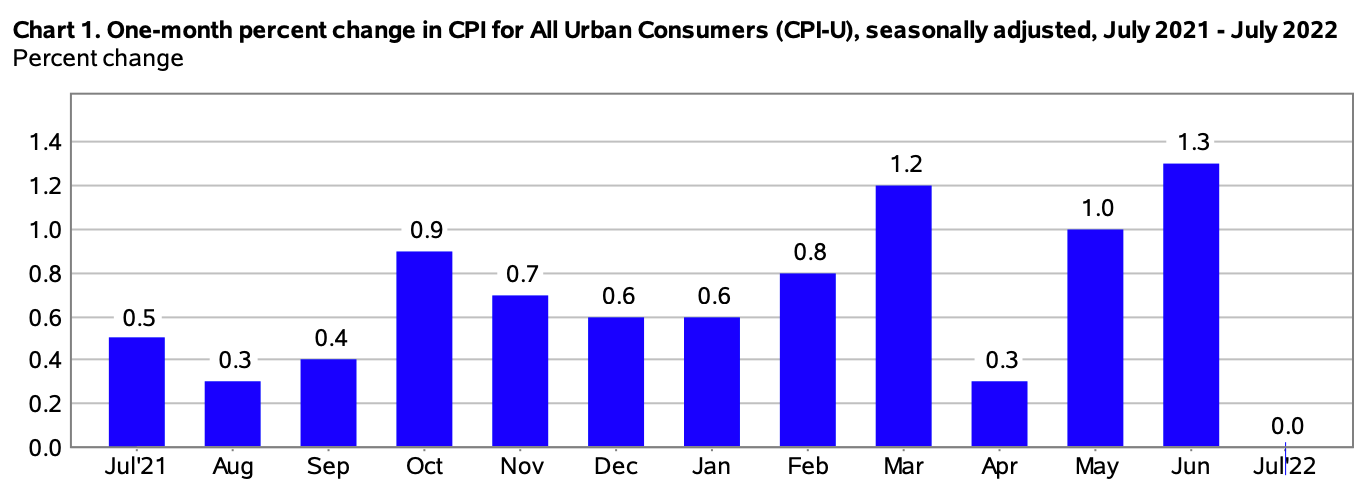
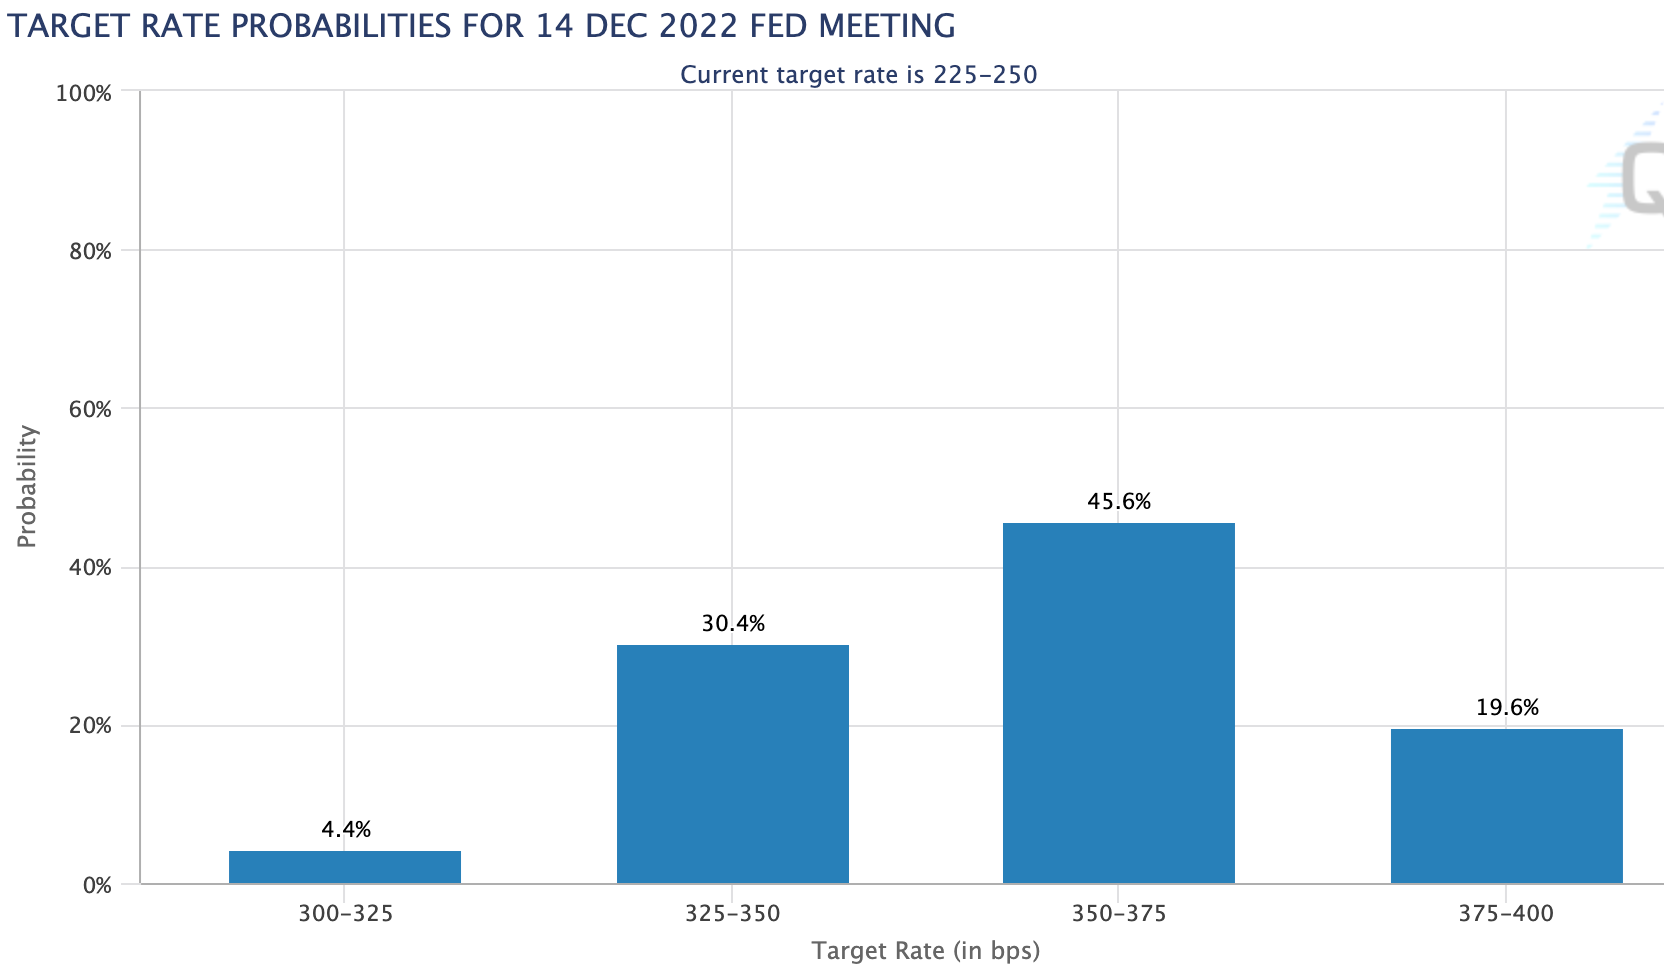
Going back to bond yields, the reason why this cooler inflation is important is that it adjusts the expectations for rate hikes for the rest of the year. If rate hike expectations continue to come down, this will further fuel the market rally as financial conditions ease from where they are today because expectations the market price of the 10 year yield, and 2 year yield, will come down. Today, we have another 1.25 bps being priced into the markets for this year. If inflation comes down, expectations will come down which will further fuel the market rally.
Data is Still Coming Out
As data continues to trickle in, it will be important to pay attention to the incoming economic data. The biggest I can think of are:
Jobs numbers - hopefully we don’t see weakness here
Inflation - we need to continue to see this come down. PPI is the next big report as well
GDP data - we are in a technical recession. We should look for this not to deepen.
Jerome Powell said, “we will continue to be data dependent.” This means that data will drive the markets behavior. As long as the picture improves, the markets will rally.
A New Stock I Added
I will need to do a more in depth explanation in this weeks portfolio update but I have been tracking this business since it came public.
Keep reading with a 7-day free trial
Subscribe to BluSuit to keep reading this post and get 7 days of free access to the full post archives.