
Mid-Week Memo: Technical Break Down
Mid-Week Memo: Technical Break Down
Market Technicals and Key Area's of Support

The Technicals of the Market have completely broken down, which has created a lot of concern among traders and investors about a potential next leg down. In this Memo, I wanted to provide you, the reader, key levels to watch as well as moving averages to pay attention to.

For those of you not familiar with (or who are familiar with) technical analysis, the goal here is to identify trends as well as structural patterns to help us get an idea of where the market will head next. First, I will provide data points I am watching with context about what it means, and then, consolidate all the data to develop a thesis about the direction of the market within the next 1-2 weeks and months. This will be helpful for investors and traders to:
Identify hedging/shorting opportunities
Identify good buy zones for long positions
Provide an idea, for investors, about what to expect with their portfolios in the short and long term
*Quick Plug*
If you’re not already, consider becoming apart of a community with thousands of members receiving my bi-weekly newsletter that covers fundamentals of equities, macro research, market analysis and technical trends.
If you’re interested in partnership opportunities with BluSuit. Email me, Dillon, at BluSuitInvestments@Gmail.com
*End Plug*
Alright, Let’s get back to it
Market Technicals Have Broken Down This Week
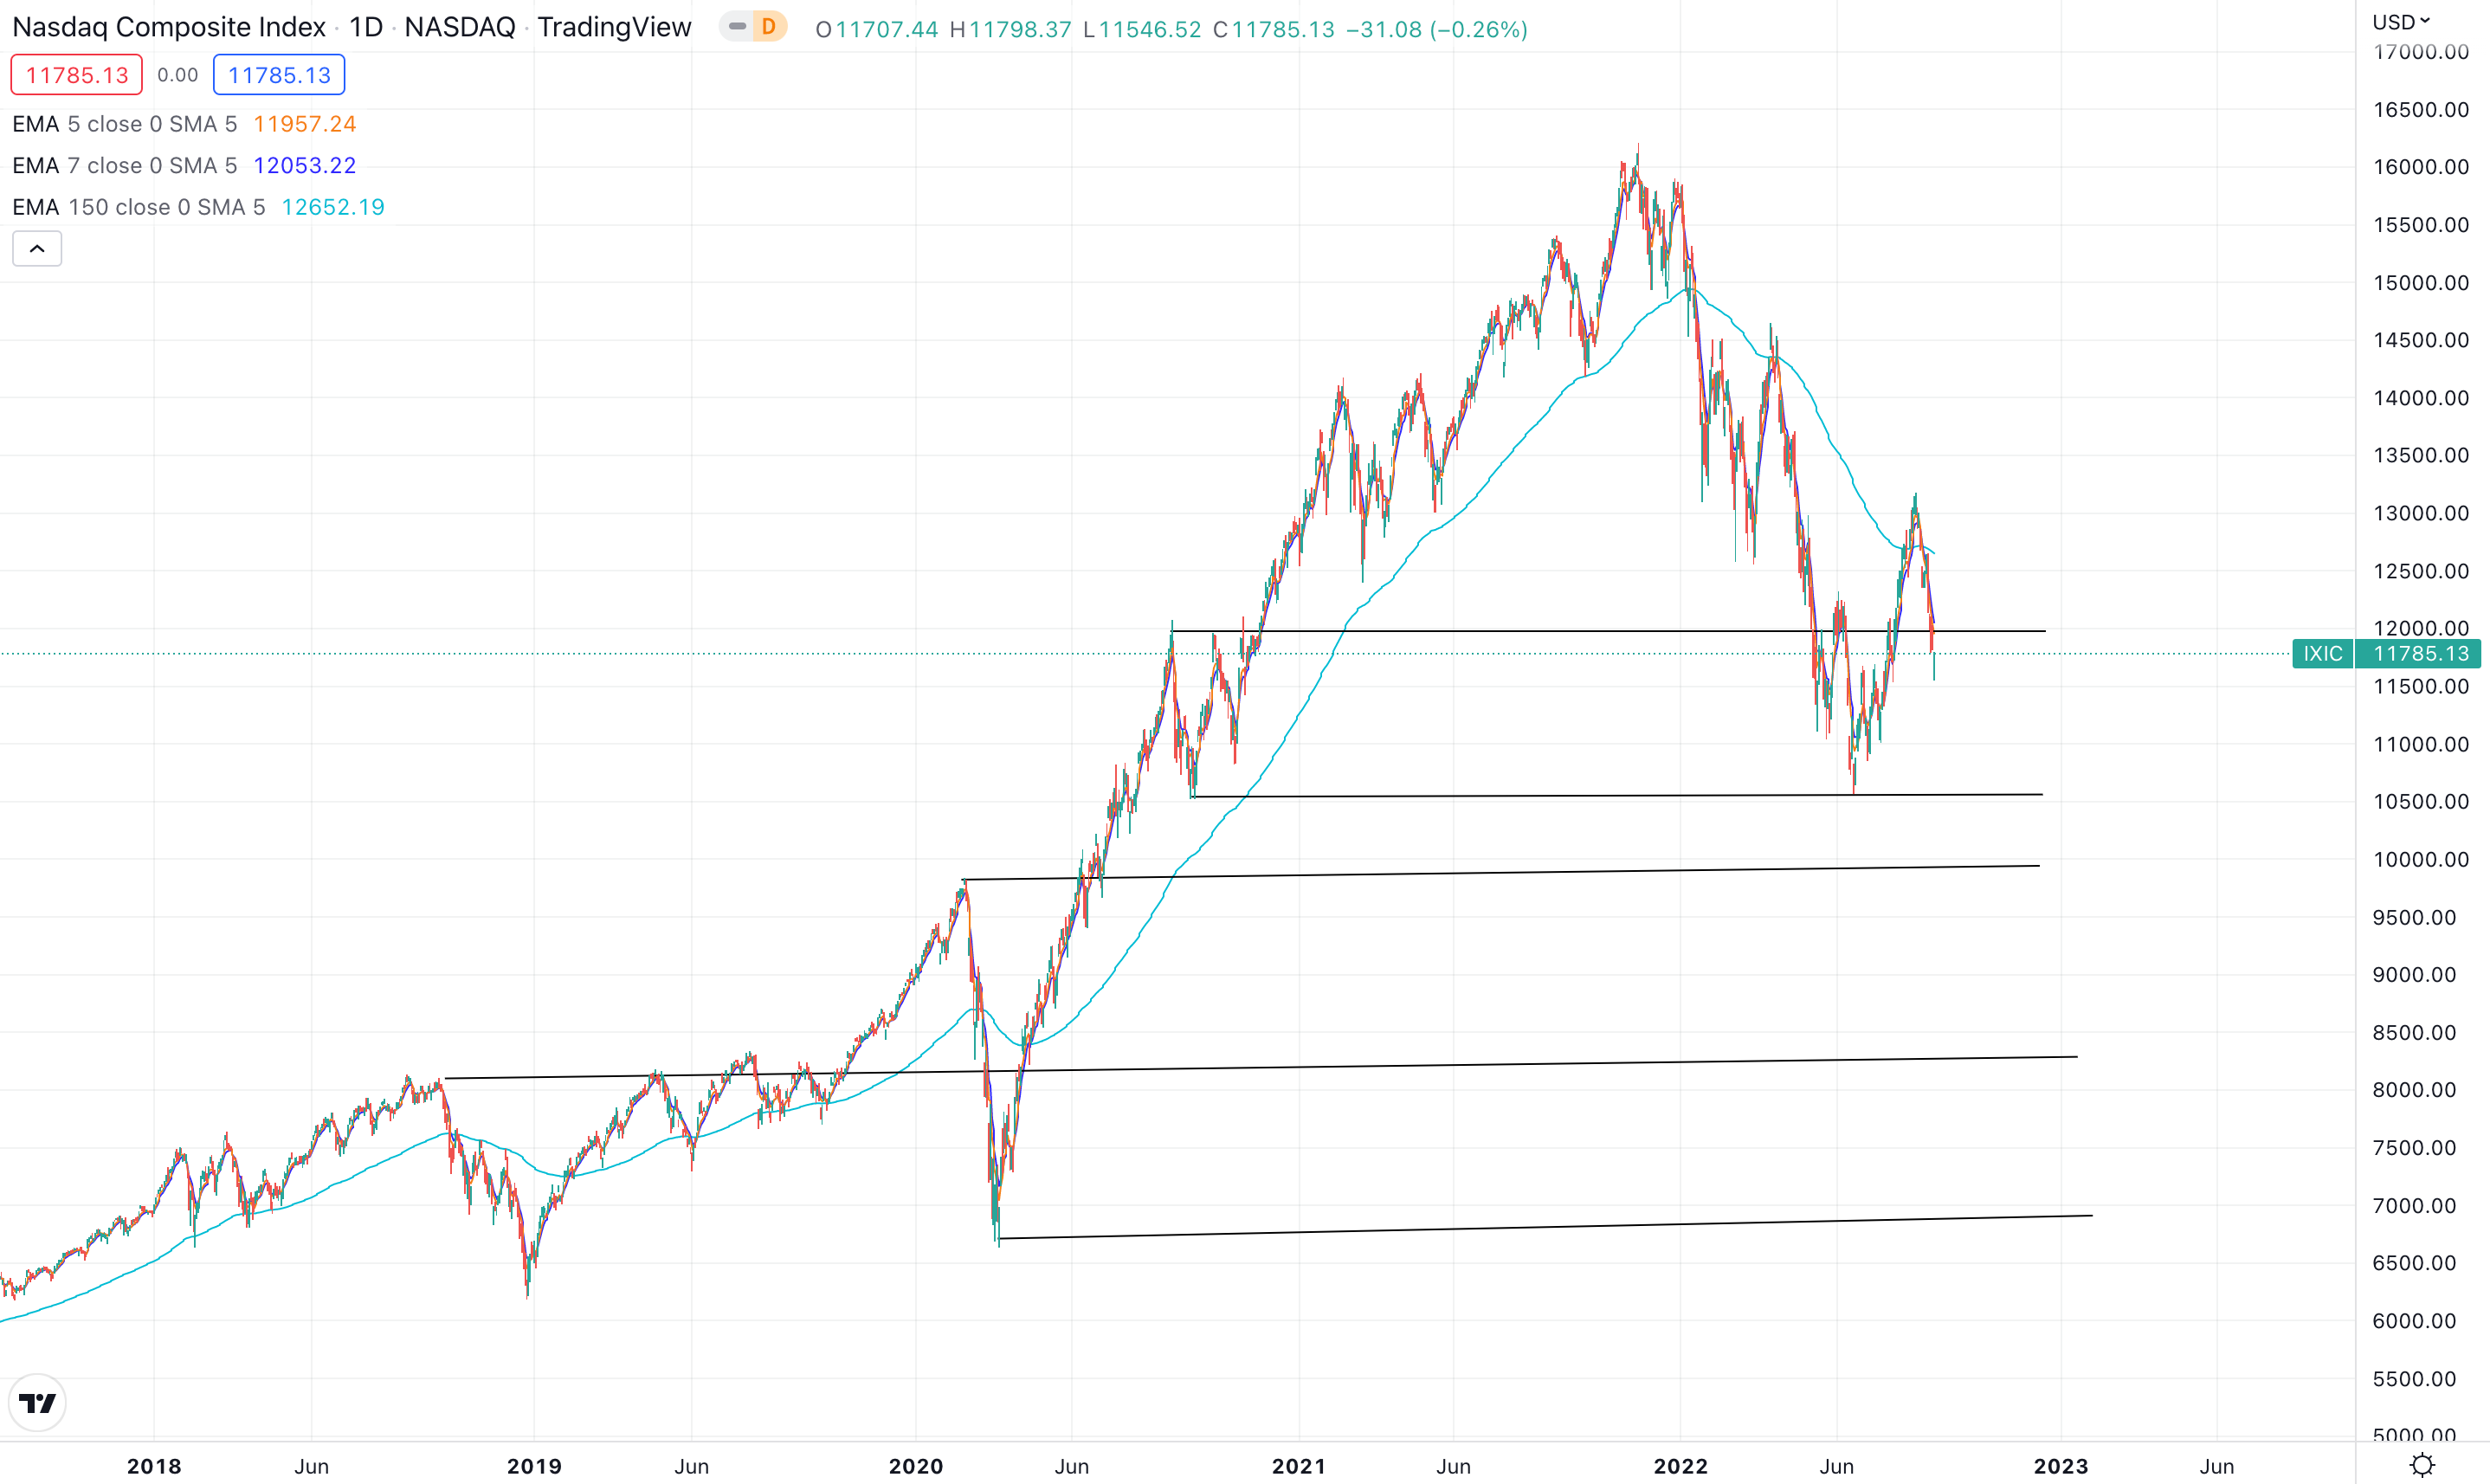
A key level I was watching, the 50 day moving average, broke down with force this week. What this means is that there will be no meaningful short term rally and the previous uptrend is completely invalidated. A new base will need to form now, but the question is, “where is it?”

Looking at the chart above, it does not look good for bulls no matter which way you perceive it. The MACD is trending downward, which signals that we are likely still in the middle of this move downward, and the RSI still has not quite reached over sold levels. Perhaps the only saving grace, that I can think of, is that we have had a very aggressive move downward, with no bounce. I would expect at this point that shorts will cover and dip buyers will step in, creating a short term bounce in the markets. Very rarely do we see 5 consecutive trading days in a row that are negative without some sort of follow up move upward.
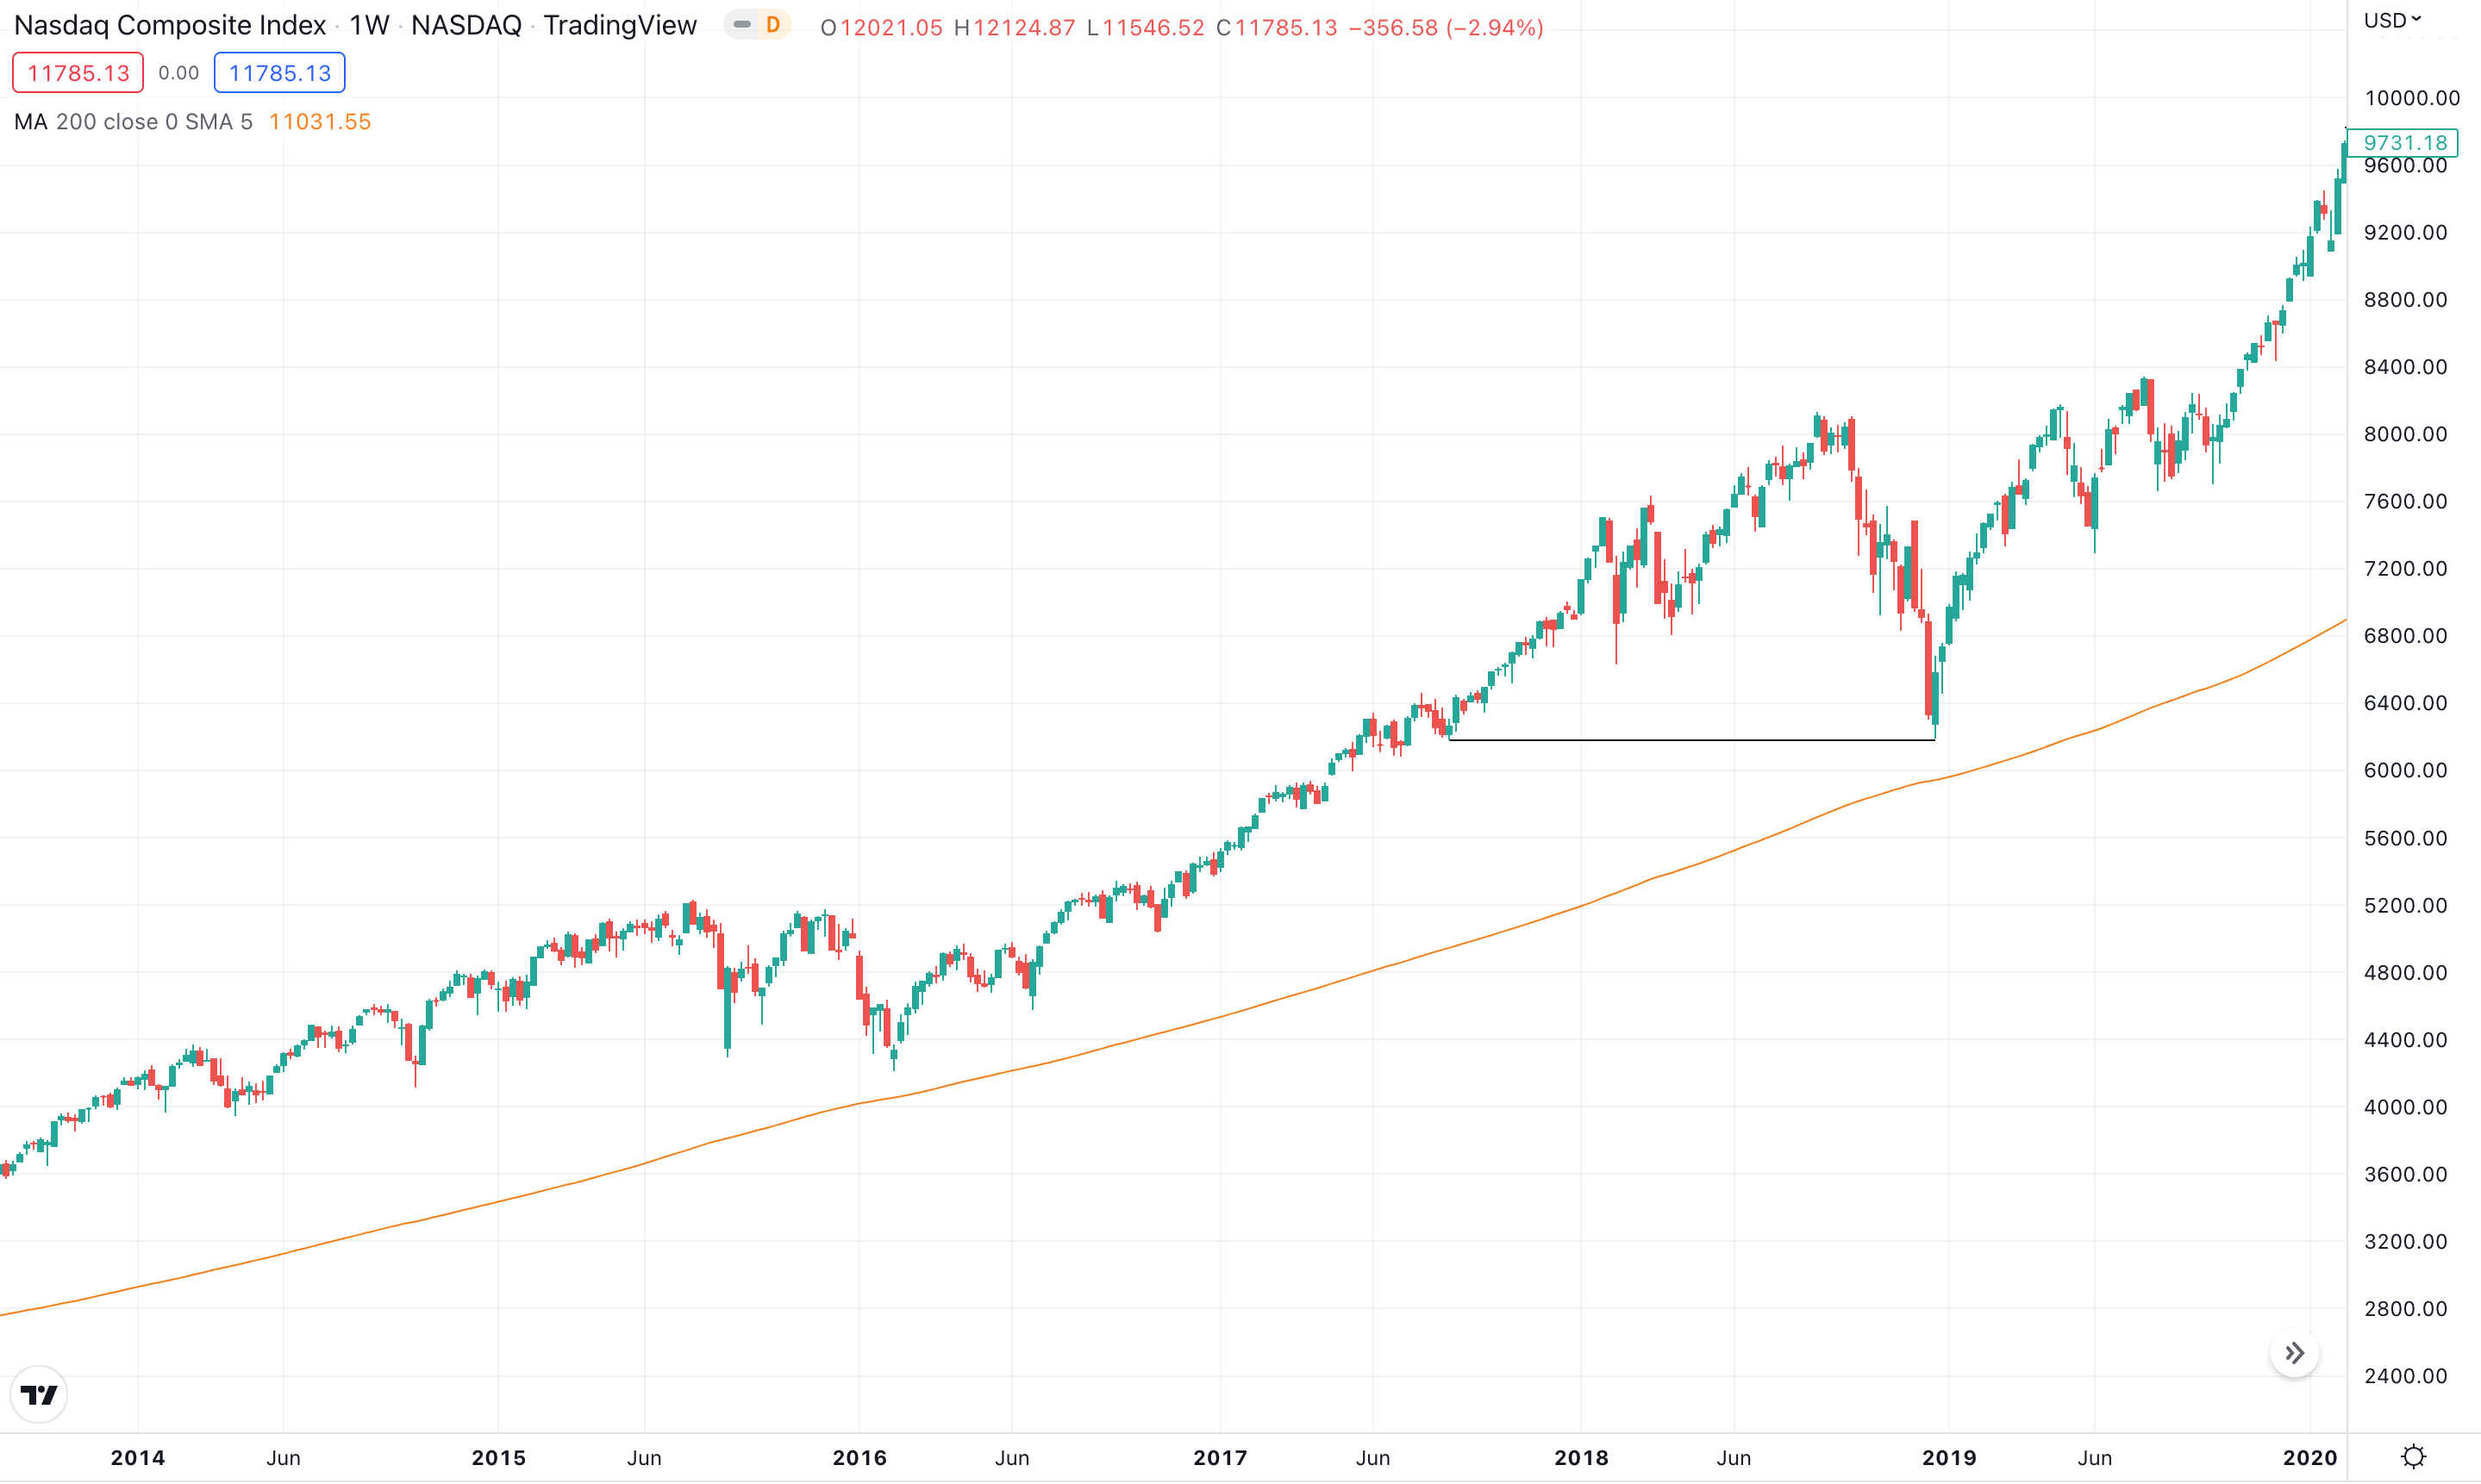
At first glance, this is as ugly as it gets guys. If we zoom out just 4 years and look at the structure of the overall markets (by structure I mean area’s of previous support/resistance) it actually makes a lot of sense that the markets bounce(d) here. We will likely be in this range for a period of time. But, my warning, if we break down below our previous low made in June we need to look out below. The COVID low quickly comes into view, which will be a draw down larger than the 2008 GFC. If I had to guess (if the previous support breaks) 8,500 makes a lot more sense than the COVID low. This will be approximately a 50% draw down in the NASDAQ.
What to Look for in the Next Bottom
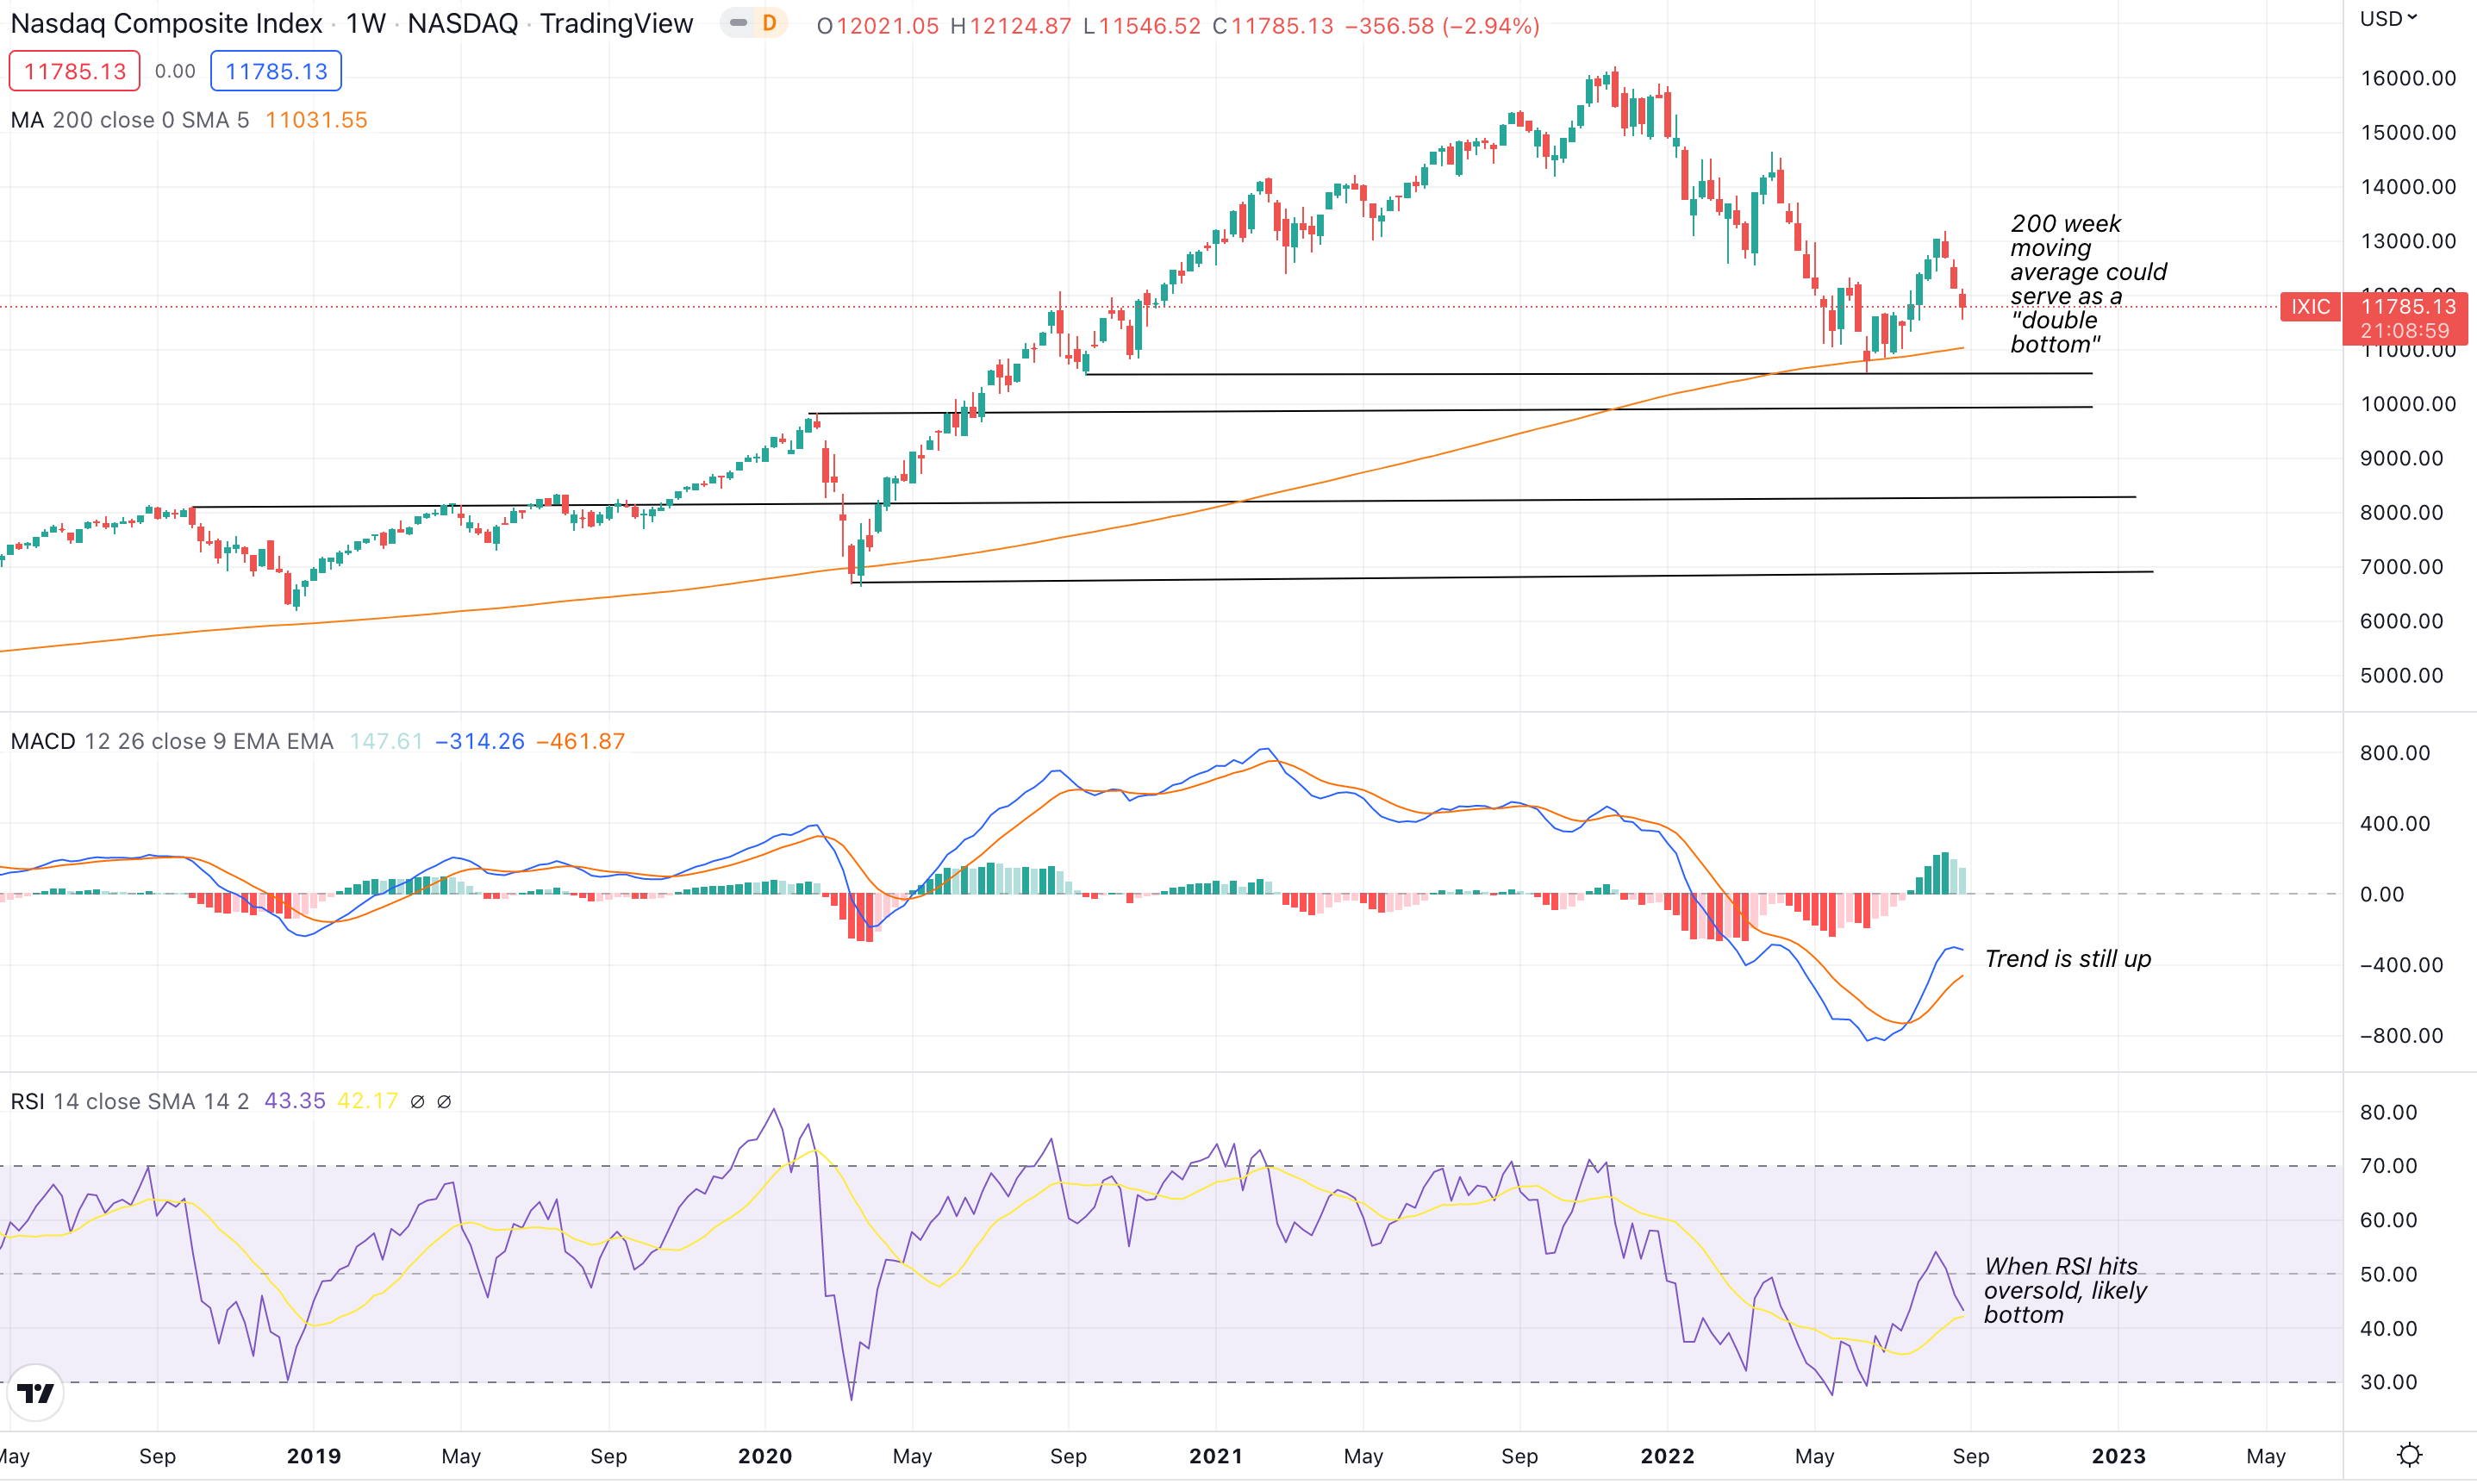
Historically, on the weekly NASDAQ composite, it has signaled every major bottom. In fact, you can usually identify bottoms by looking at the 200 week moving average and the RSI (relative strength index). In every bear market since 2008, the 200 week moving average has served as a major support line and you notice that even today, the NASDAQ bounced off the 200 week (orange line). It’s still to be determined if that was the major low but the over sold signal on the RSI is a strong indicator for when the next bounce will occur if the selling continues.
The chart above and the chart above that both depict those black lines. Typically, you can identify previous highs and lows in the market on a historical basis to see exactly where a bottom might be. For example, in 2018 it was a previous low that marked the bottom. They were identical levels.
Knowing these levels help you understand where a market can drift toward. Some traders refer to this as “closing the gap”, or a gap of where buyers and sellers existed in a given market. When a market goes straight up, it usually goes straight down because there were no structural area’s of accumulation from longer term investors. In addition, on a psychological perspective, people are much more likely to hold a position if they are in profit. If it begins going negative, “look out below”, people usually sell.
If You’re Looking to Hedge into this Downturn
Hedging, or shorting, here, today, does not make much sense from a technical perspective. You leave yourself vulnerable to a face ripping rally as the technicals and set up’s are just not aligned, yet. To know what to look for, there are two key charts I watch to determine short term trend and areas to place a hedge.
1.) The Shorter Term Moving Averages
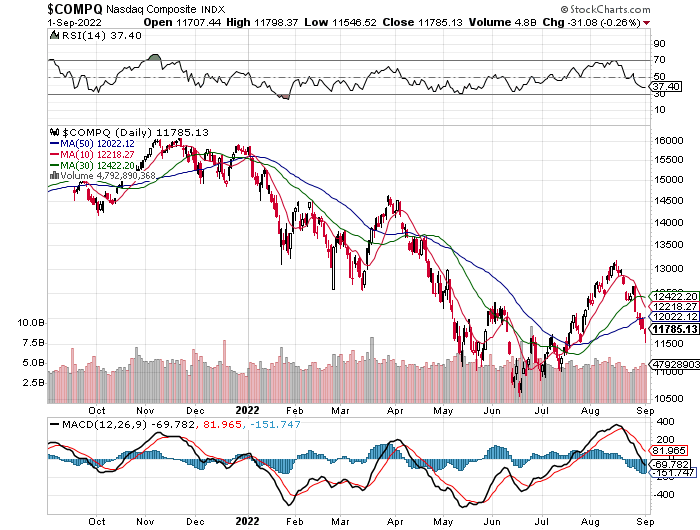
This chart is a big reason why I think we are slightly over sold, today. There is nothing saying that this is the absolute bottom but the selling has recently been so aggressive that price action has become detached from its short term major moving averages. Typically, markets don’t crash like they did during COVID and they usually bounce up and down. If I was looking to place a hedge against the NASDAQ, I’d be looking to place it if it clearly fails to the downside at the 10 day moving average. From there, I’d be looking to place my stop loss at my point of entry till the 30 day moving average catches up. From there I would move my stop loss down (with price action) to protect profits.
2.) The Short Term Momentum Indicator, 5 & 7 EMA
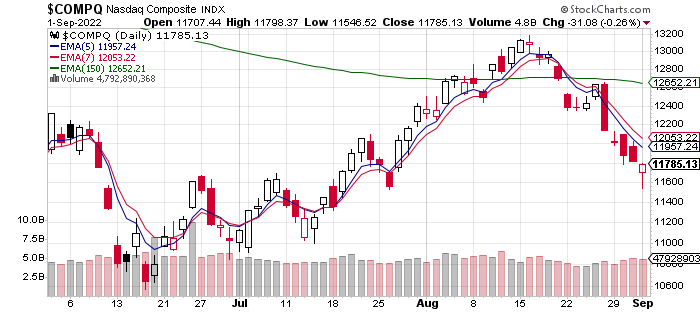
The 5 & 7 ema, when trading below the 150 ema, is a strategy I picked up from Puru (a popular Twitter personality). This strategy helps you identify the short term trends in a bear market. As you can see, when the 5 ema is below the 7 ema, the short term trend is down and the market often respects this moving average. This works in reverse as well during bear markets. When the 5 ema is above the 7 ema, the trend is up.
The idea in this strategy is to have your hedge on when the trend is down (obviously) and take your hedge off when the trend is up. This is not perfect and often times, it is best coupled with the first strategy I was talking about where you can use the major moving averages. By using the major short term moving averages you can quickly identify where there are area’s of support/resistance, along with the technical structure, to identify area’s where the trend can potentially reverse to the upside and down side.
Let Me Summarize
I wanted to equip the average every day investor/trader with a few tools, as well as an understanding how the markets are moving on a technical perspective to a new market low. These strategies are complicated and I strongly recommend practice because shorting and hedging is typically a leveraged bet experienced traders/investors use.
This does take practice and requires an investor to control their emotions. Countless times I have been stopped out of my hedges because I moved the stop loss too close, or there was a vicious short squeeze. Only with time and experience can you really get the process down.
The number 1 thing to know is that hedging in itself is a very large position. Typically you hedge a % of your portfolio to run a “neutral” market risk, which can be 25%, 50%, 75% or 100% of your portfolio. Losing money on these trades typically don’t go well if you’re not executing properly and do not protect volatility risk. Short squeezes can make you question everything in a hurry.
As far as a direction to the markets, when I couple what I know about Macro, I can quickly draw the conclusion that it is very likely the markets will undercut the previous lows. Very likely doesn’t mean absolute, it simply means there is a higher probability of an outcome. Two plans should be developed based on probabilities (rather than opinion) in all situations, which is why I am talking about hedging here while using stop losses.
The market is a crazy thing and can reverse if there’s data I am missing in my technical and macro analysis.
In My Next Portfolio Update
I will cover the macro, what the bond market is saying and a new possibility that I recently stumbled across while listening to a retired macro strategist. Sneak Peak, it has to do with the historical boom/bust and easing/tightening cycle of fiscal/monetary stimulus.
The idea with this complete approach is to couple our portfolio strategies with what we know about the direction of the credit cycle and economic cycle on both a short term and long term basis. Simultaneously we combine this knowledge with technical data to become a complete portfolio manager.
In addition, we will talk about my portfolio and how I am making the most of this bear market opportunity (on both a short/long perspective) as well as the individual secular growth stocks I have the highest conviction in.
Till This Weekend, Stay Tuned, Stay Classy
Dillon
Nice man, love the breakdown on hedging strategies. It's a great baseline for people to develop their own tool kit.