
MidWeek Memo: Inflation, Fed Policy and Market Direction
MidWeek Memo: Inflation, Fed Policy and Market Direction
Market bottom or another leg down?

The amount of time I spend thinking about the markets is, at times, equivalent to a hungry man seeking food or a thirsty man seeking drink. From market philosophy, to macroeconomics and technicals structures/patterns, it’s truly a passion of mine. The future and what the probabilistic outcomes usually comes at the fore front of my mind and occupies a majority of my thoughts. Typically, I take into account:
Macro
Sentiment
Technicals
Fundamentals
Economics
Today, I have never seen the picture so mixed. At the time of writing, it’s Wednesday September 14th and we just came off a 4% down day, the day prior. These extreme, soul crushing, days are few and far in between. It has led many investors to believe that we are inevitably heading for another leg down and some believe (like Perma Bulls Tom Lee and Cathie Wood) that the bottom is likely in. I am in this camp but I have also grown to believe that hedging should be a tool used in a long term investors portfolio to minimize draw downs.
This hedging strategy not only allows me to prevent big draw downs but it also allows me to raise capital to reinvest at bottoms. These inadvertent benefits are nice to have. However, the real positive is that it brings balance to my mindset as I often have to ask myself two questions:
Do I hedge (short) here, or
Is this a bad setup?
More or less, it allows me to seek short selling opportunities. When shorts go right, it goes really right and can raise an exciting amount of capital to buy more of my favorite company’s. On the other side of this trade, when it goes wrong, it can rip your portfolio apart because it’s permanent loss rather than paper loss.
What I am trying to say is that I’m approaching my analysis from a purely objective, opportunistic, way. I can and will make money on either side of the coin. Today, I am going to make a bold prediction and share the strategy I am using based on my assessment of the markets. By the end, my hope is that it gives you (the reader) something to think about when making your own decisions about your portfolio.
*Sponsor*
I use Trading View for much of my market analysis. If you’re considering upgrading your TradingView account to a paid version, use my affiliate link. It will save you $30 on a yearly subscription and $10 on your monthly subscription.
*Sponsor*
Macro Picture is Terrible
No, really, it’s terrible. That CPI report was not good. There are two different types of inflation:
Volatile inflation, that fluctuates a lot. Energy falls into this category.
Sticky inflation, which usually stays.
Sticky inflation is why this month’s CPI was so poor. The reason why sticky CPI is NOT good is that it can create a type of cycle, like a wage price spiral. Essentially the way the cycle works is that rising prices mean businesses are recording more profits but they are passing the earnings to their employees through higher wages. These higher wages, in turn, create more buying power which brings more demand to goods/services, leading back to recording more profits. Thus, creating a cycle that is extremely sticky and hard to stop.
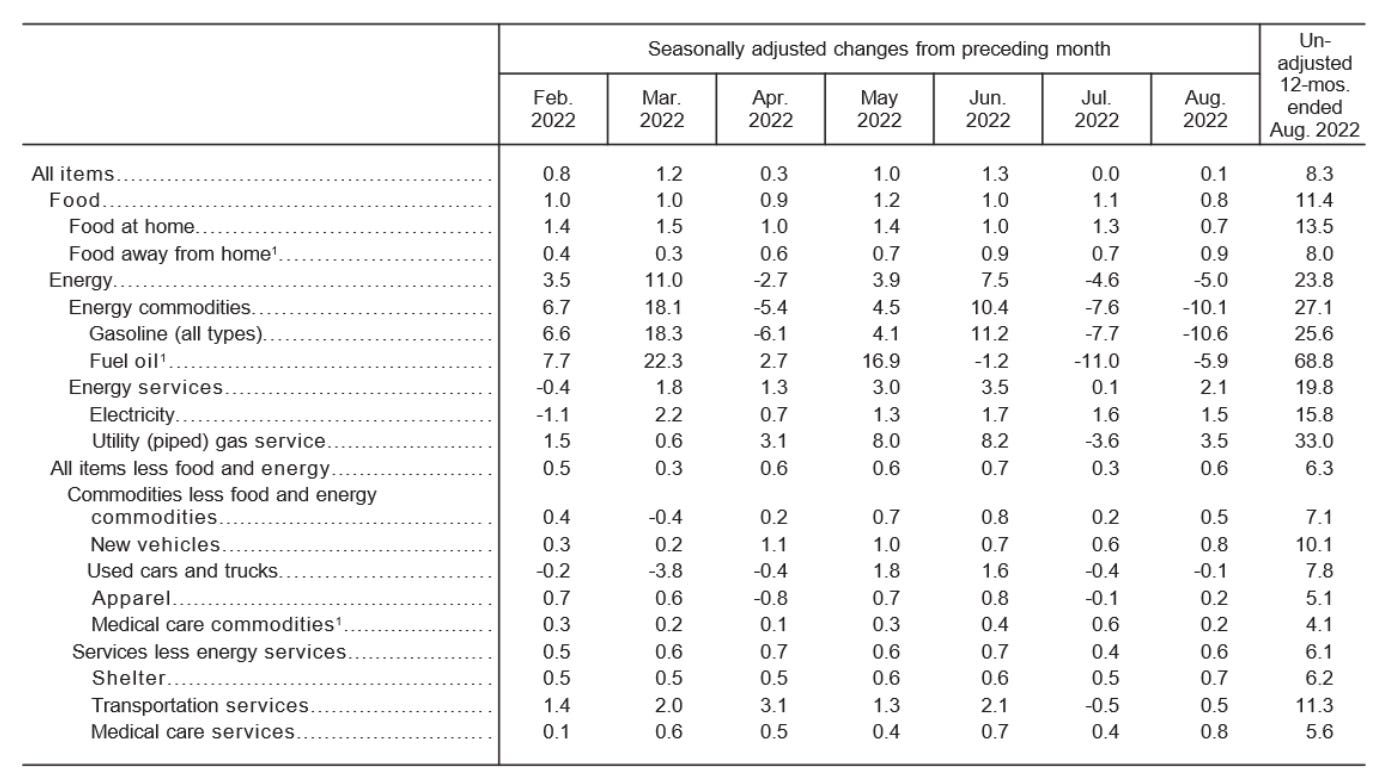
These stickier components to inflation are typically not food and energy. Food and energy work in a market, much like stocks do, but services do not. Shelter, transportation services and medical care services were really high and are not coming down despite energy falling off a cliff down -5%. Basically the inflation report was a tale of two stories.
Headline CPI continued to come down, only improving .1% MoM which would be encouraging
Core inflation, the stickier part, did not show any weakness and came in above expectations
Of course, I am not going to beat a dead horse here, there are countless pundits on Twitter, YouTube and SubStack to tell all of us the exact same thing I am saying here.
Here’s What the Majority of Market Commentators are Missing
Since November, what we have experienced has been multiple compression. Let me briefly explain. Equity markets trade lower for 2 reasons:
A compression/expansion of stock valuations
A decline in future expected earnings
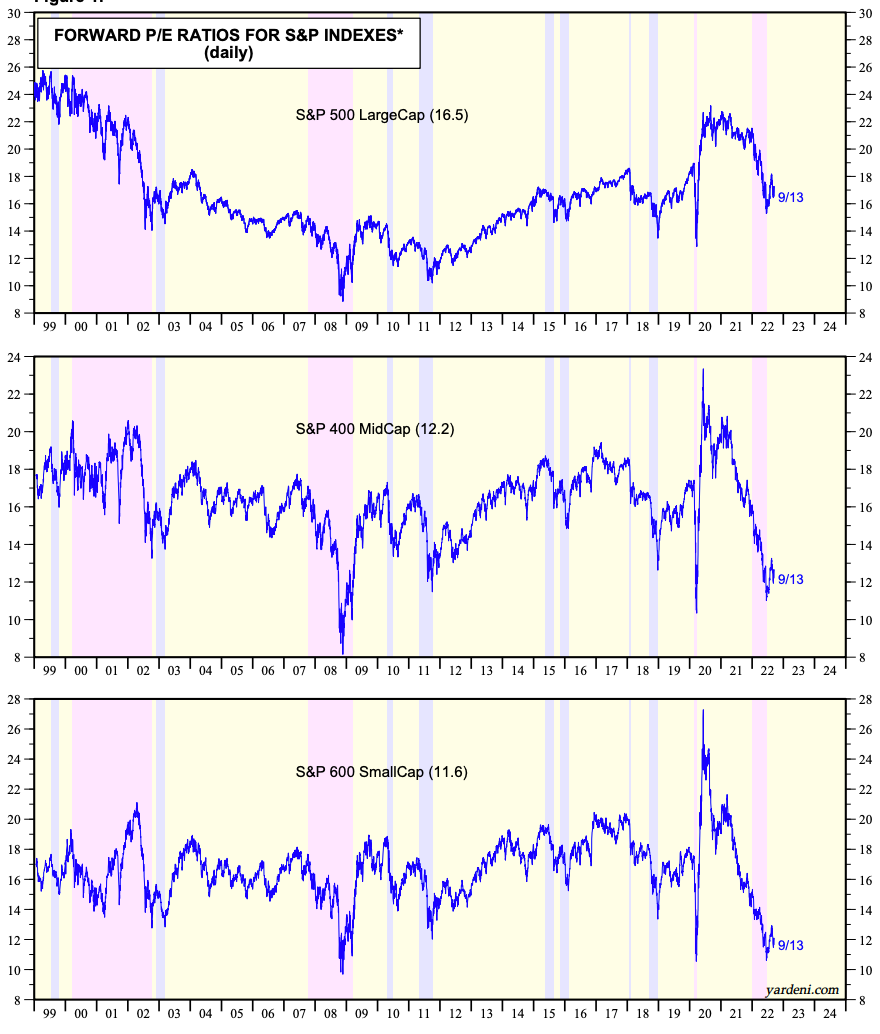
Only recently have we seen the analyst community begin to revise expected earnings down but it has not been meaningful enough to move markets. The majority of what we have seen is a decline in the forward P/E (or P/S) ratio for all corporate equities. The reason why; the risk premium has been re-rated by bond yields.
The risk premium is essentially the “risk free” return of bonds increasing, meaning the yield has become more attractive for investors to flood money to. Stocks and bonds constantly compete for capital while money managers, investors and trading algo’s flow money to various asset classes. If a 5 year bond yield is trading low, stock valuations increase. If a 5 year bond yield is trading higher, stock valuations decrease. Compliments to MacroAlf for the correlation below.
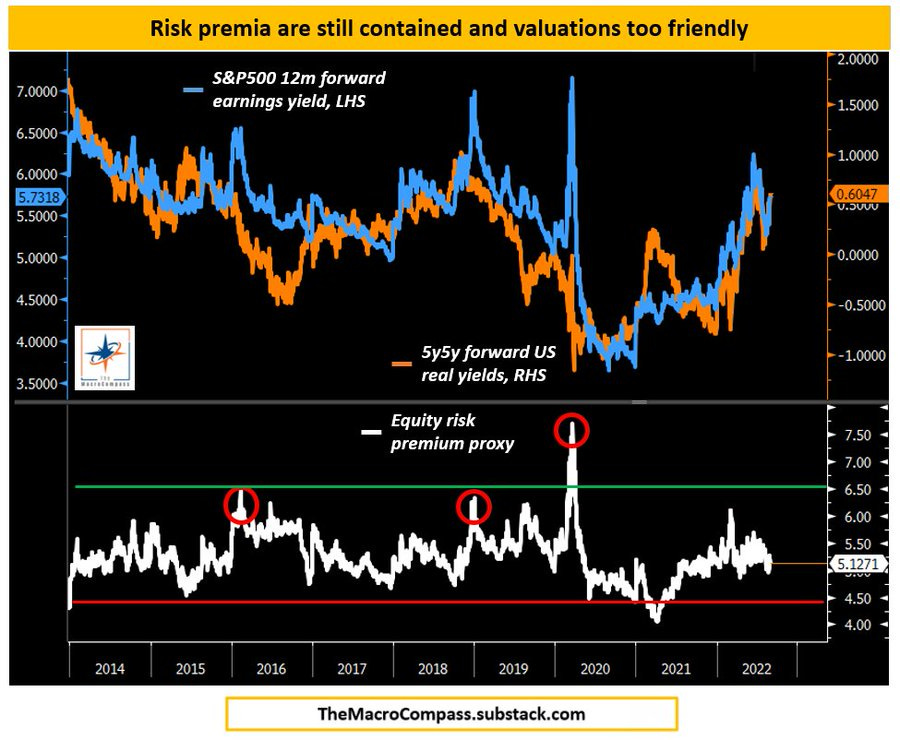
This is a very simple explanation, the full explanation can be found here:


Tuesday’s Price Action was the Bond Market Pricing in More Rate Hikes All at Once
Going into Tuesday’s CPI release, a .50 bps hike was favored for the September meeting. Now, the markets priced in a 76% chance we do a .75bps hike and 24% chance we do a full 100bps. That’s insane. The markets effectively priced in another .25bps - .50bps for September.
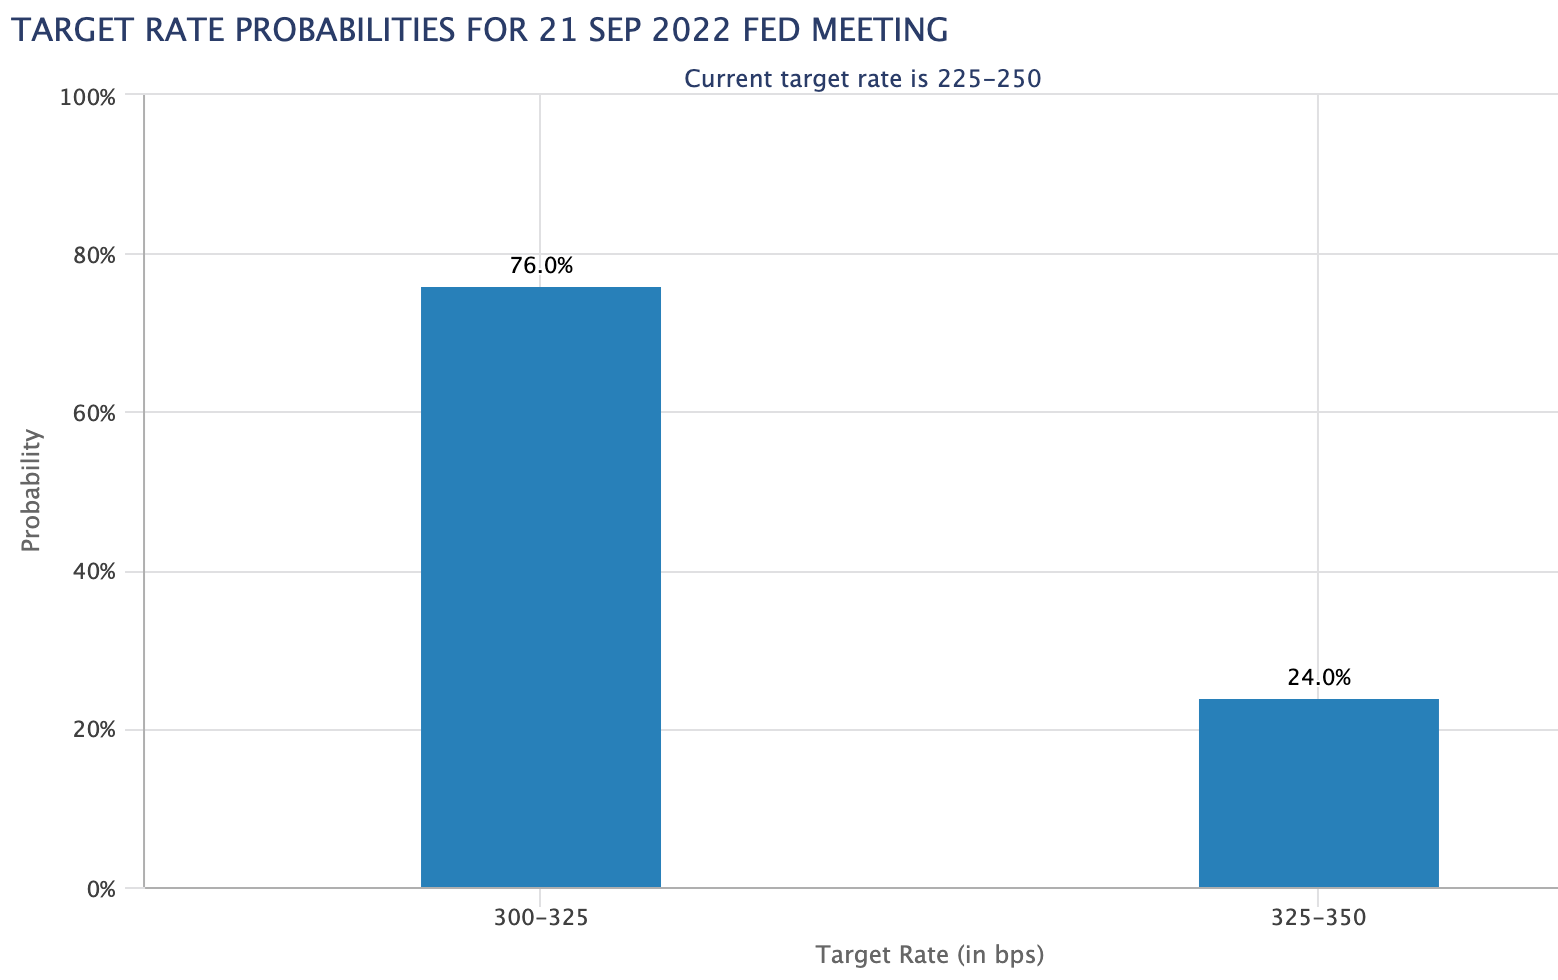
For the rest of year, we used to only have a 20% (or so) chance of getting to 3.75% - 4% on the Federal Funds rate. Now, that’s a lock and the markets are looking at getting into the mid 4% range. On a rest of year basis, the markets priced in another .50bps - .75bps for the December meeting!!

This was an aggressive move and enough to move the NASDAQ down 4% all in one day. This is most obvious in the 1 year and 2 year yields.

The massive move in the bond market is what created the sell off in the stock market.
So Here’s What is Interesting
The S&P 500 ended up forming a higher low, rather than undercutting the lows, when the yield curve adjusted to favor higher rates.
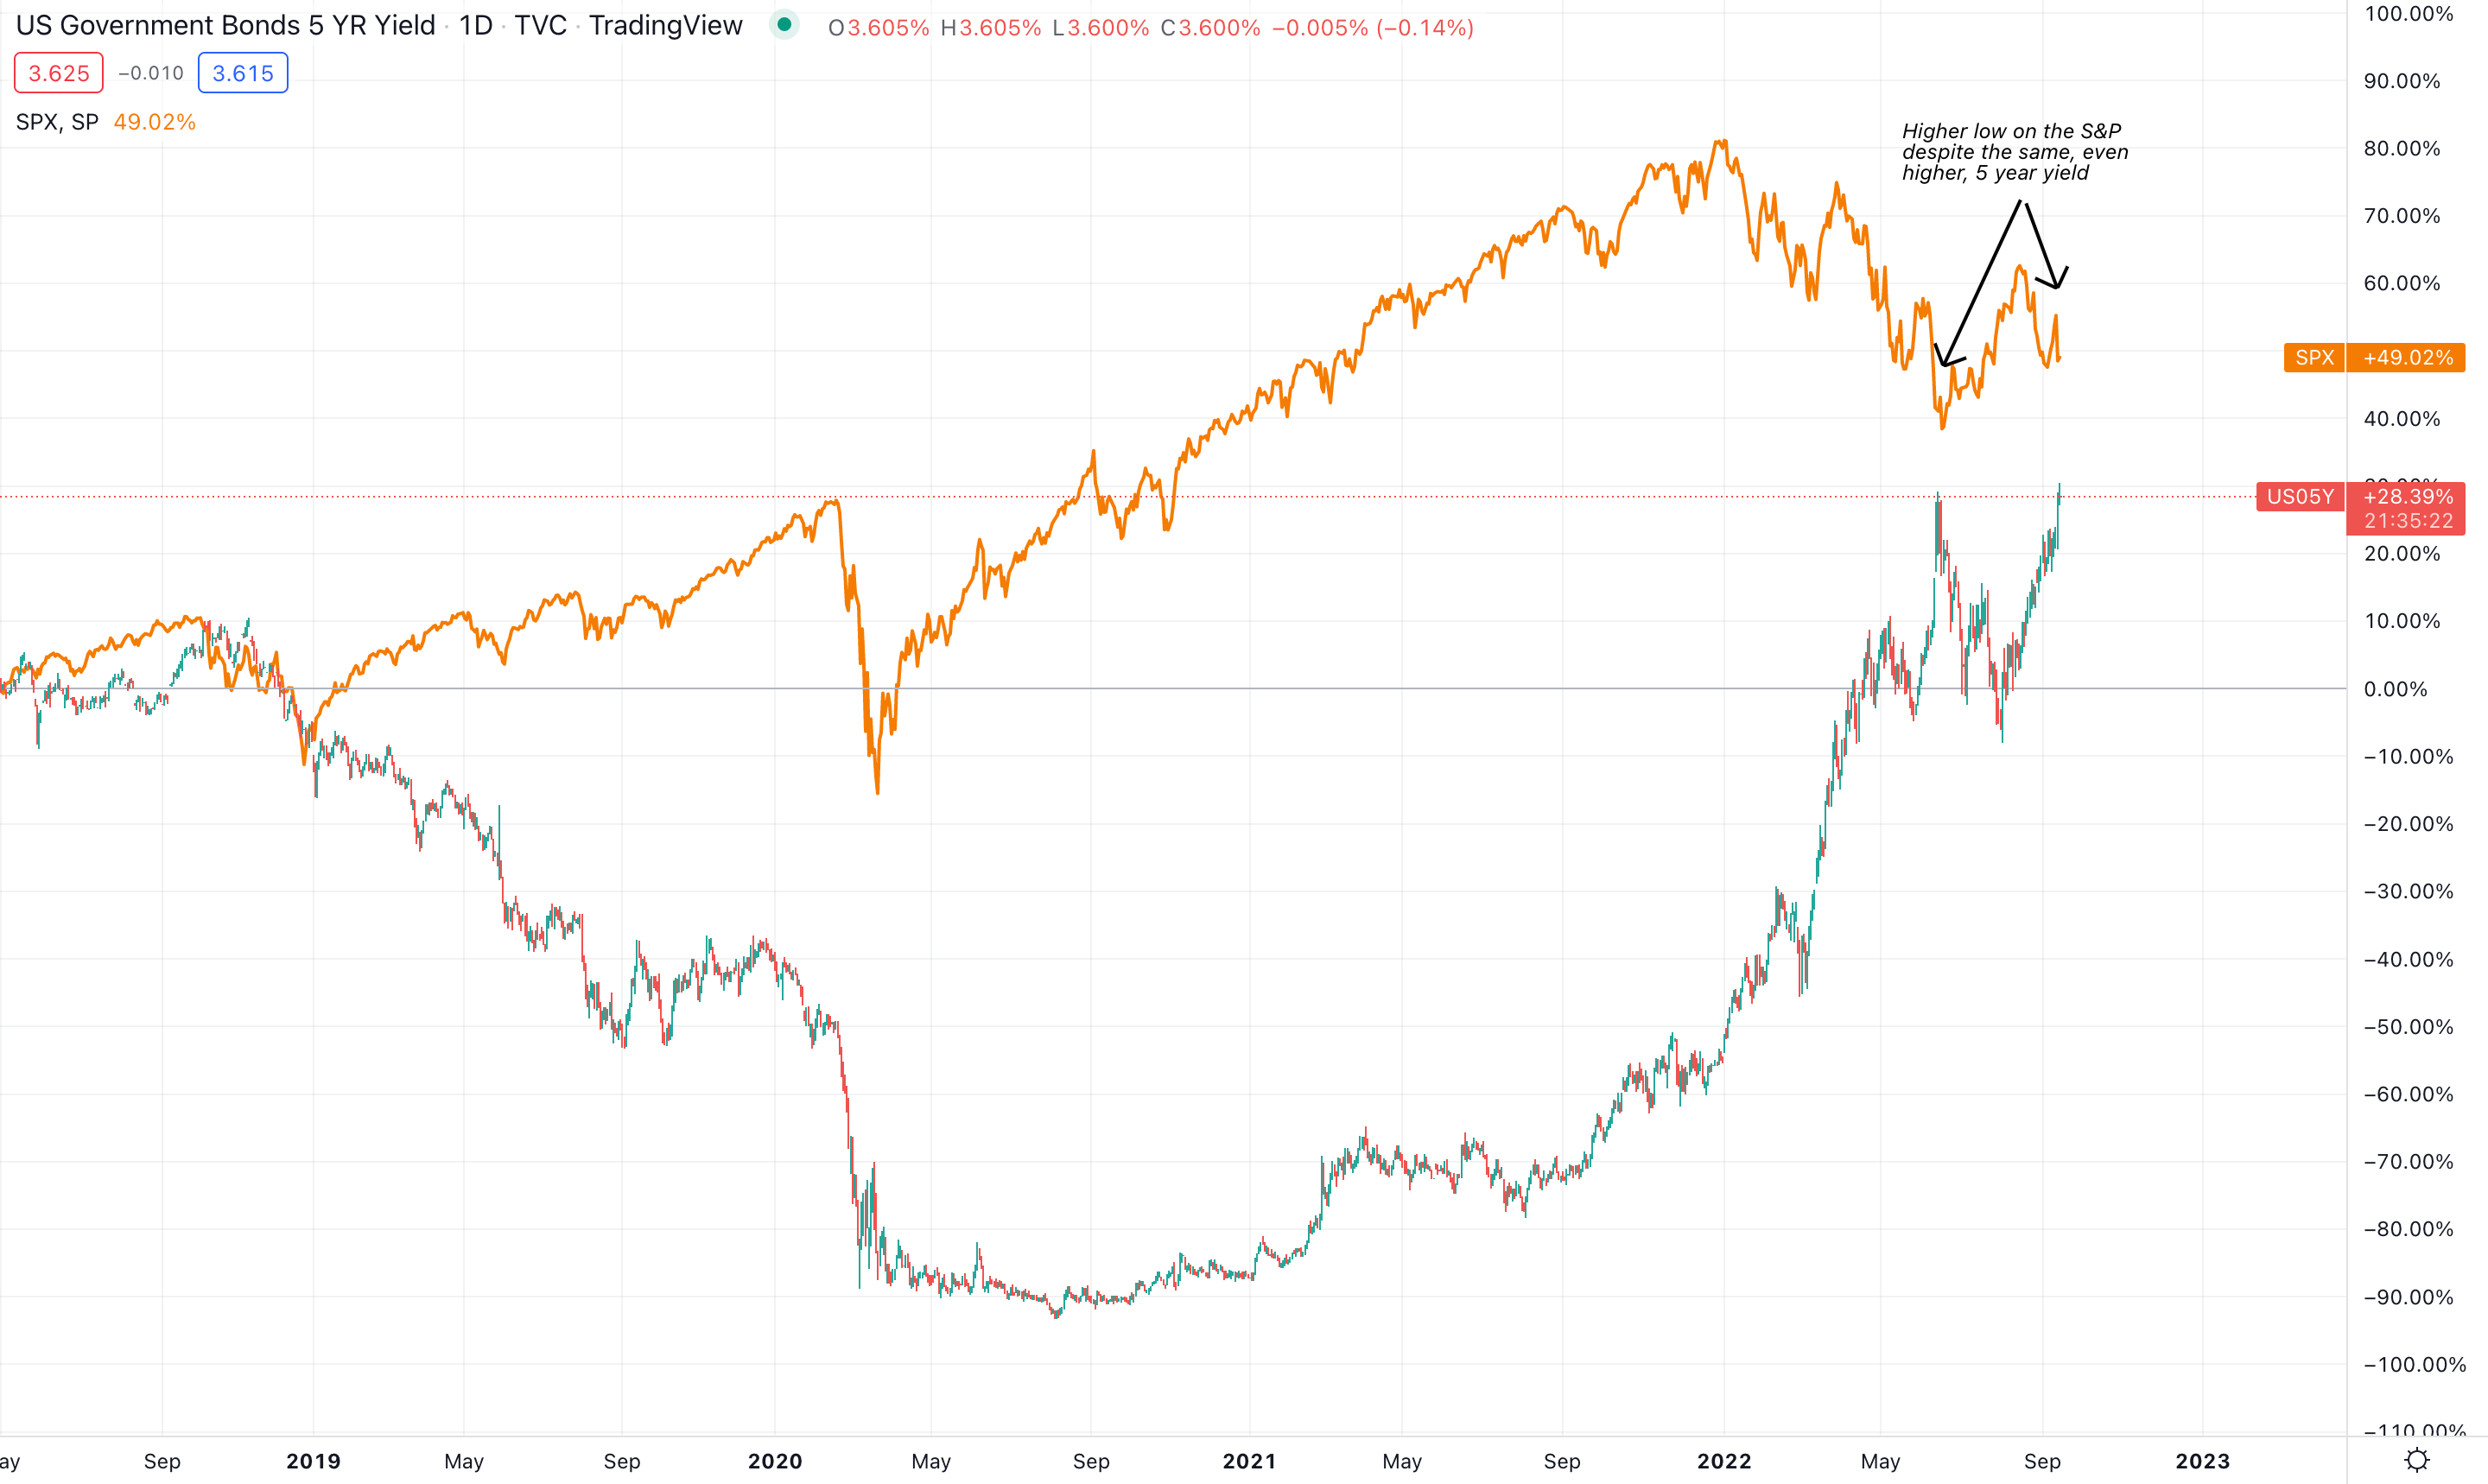
What this tells me is that multiple compression is likely done and the markets need to see poor corporate earnings, or a devastating recession, to trade down further.
The Markets Will Only Trade Down Further on Poor Earnings Outlook
I understand the macro bear perspective. Historically, the market has never bottomed until the Fed pivoted. THIS IS NOT TRUE. It is the expectations of the bond market for expected rate hikes in the future that has created the bottom in stocks. Let’s go back in time to validate this thesis.
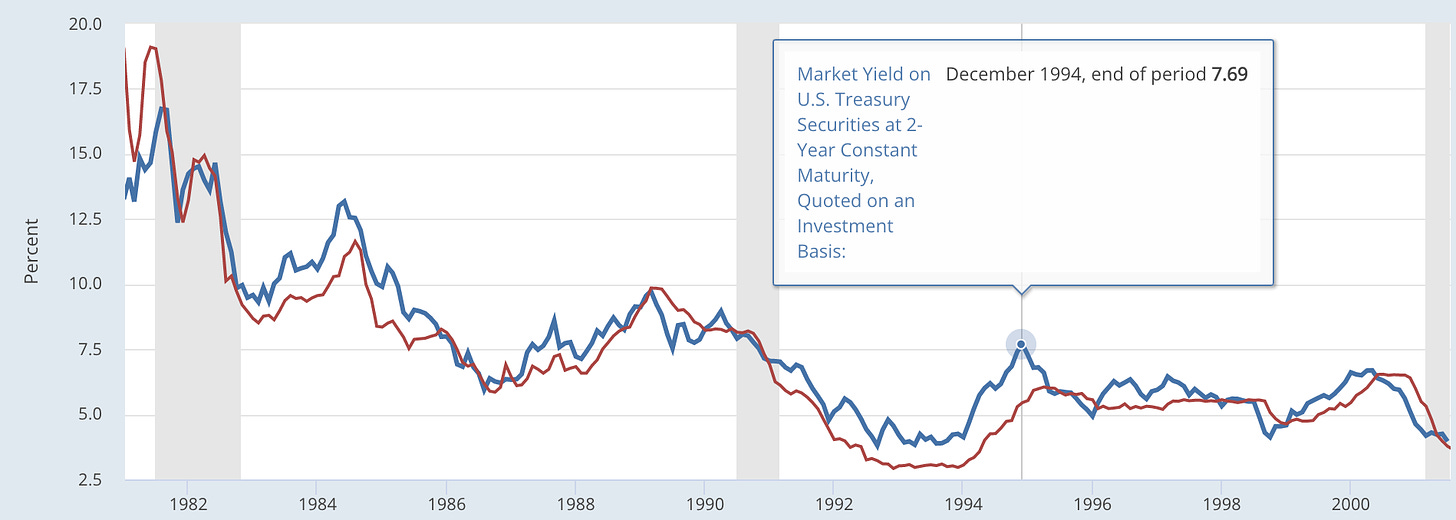
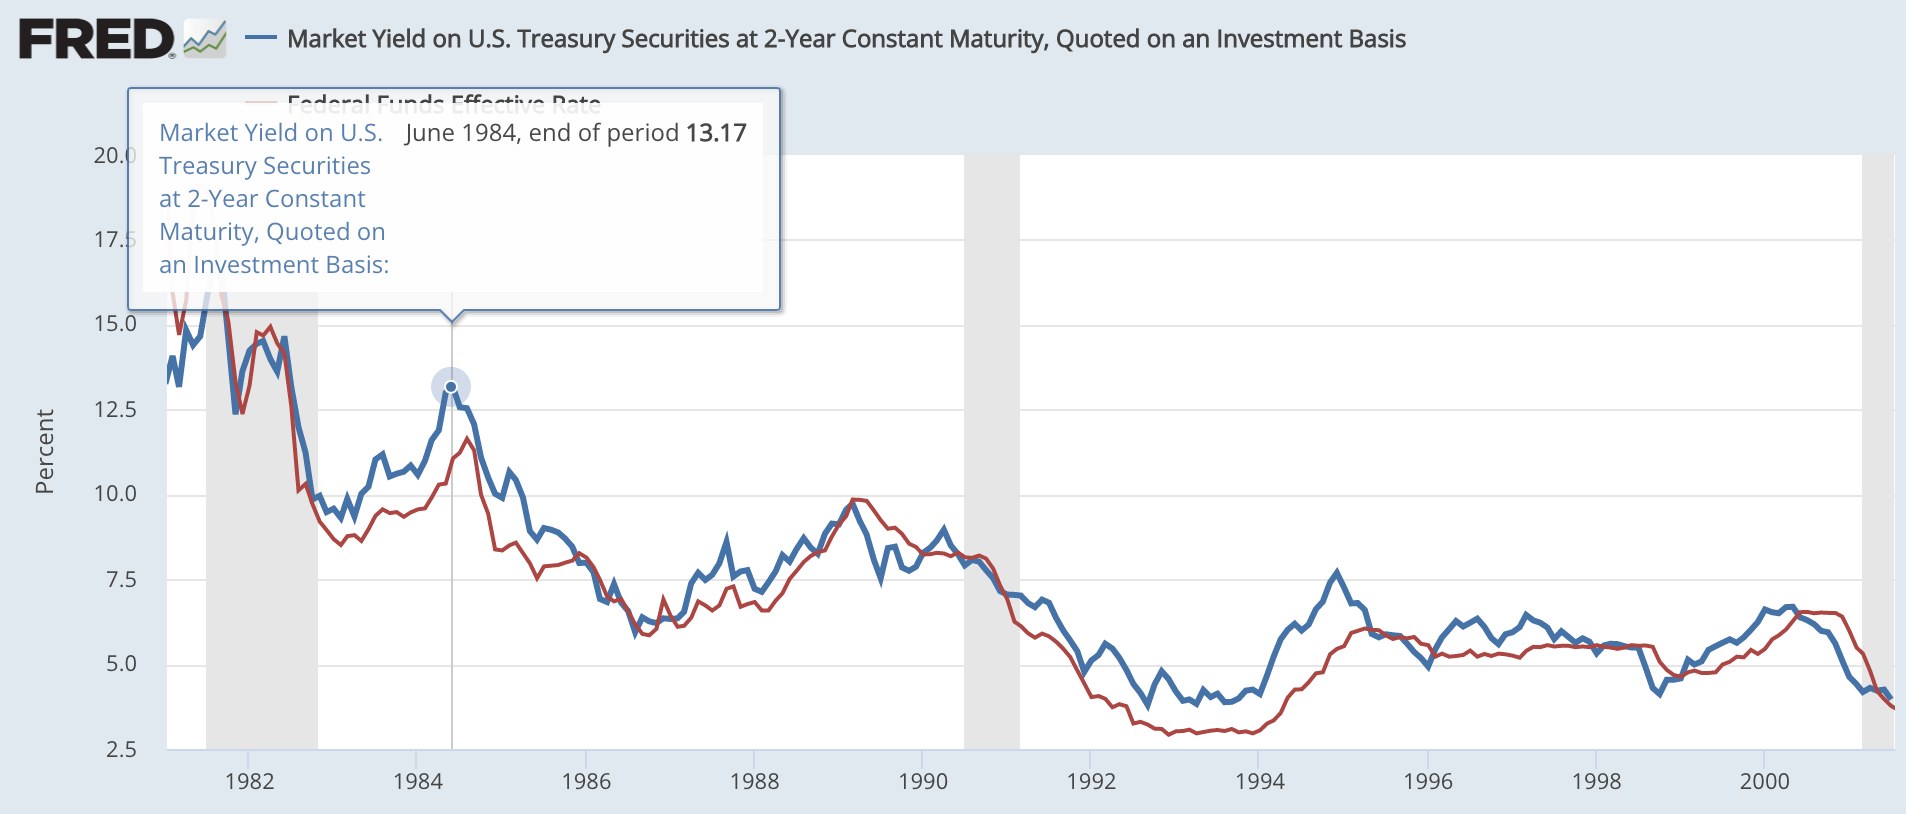
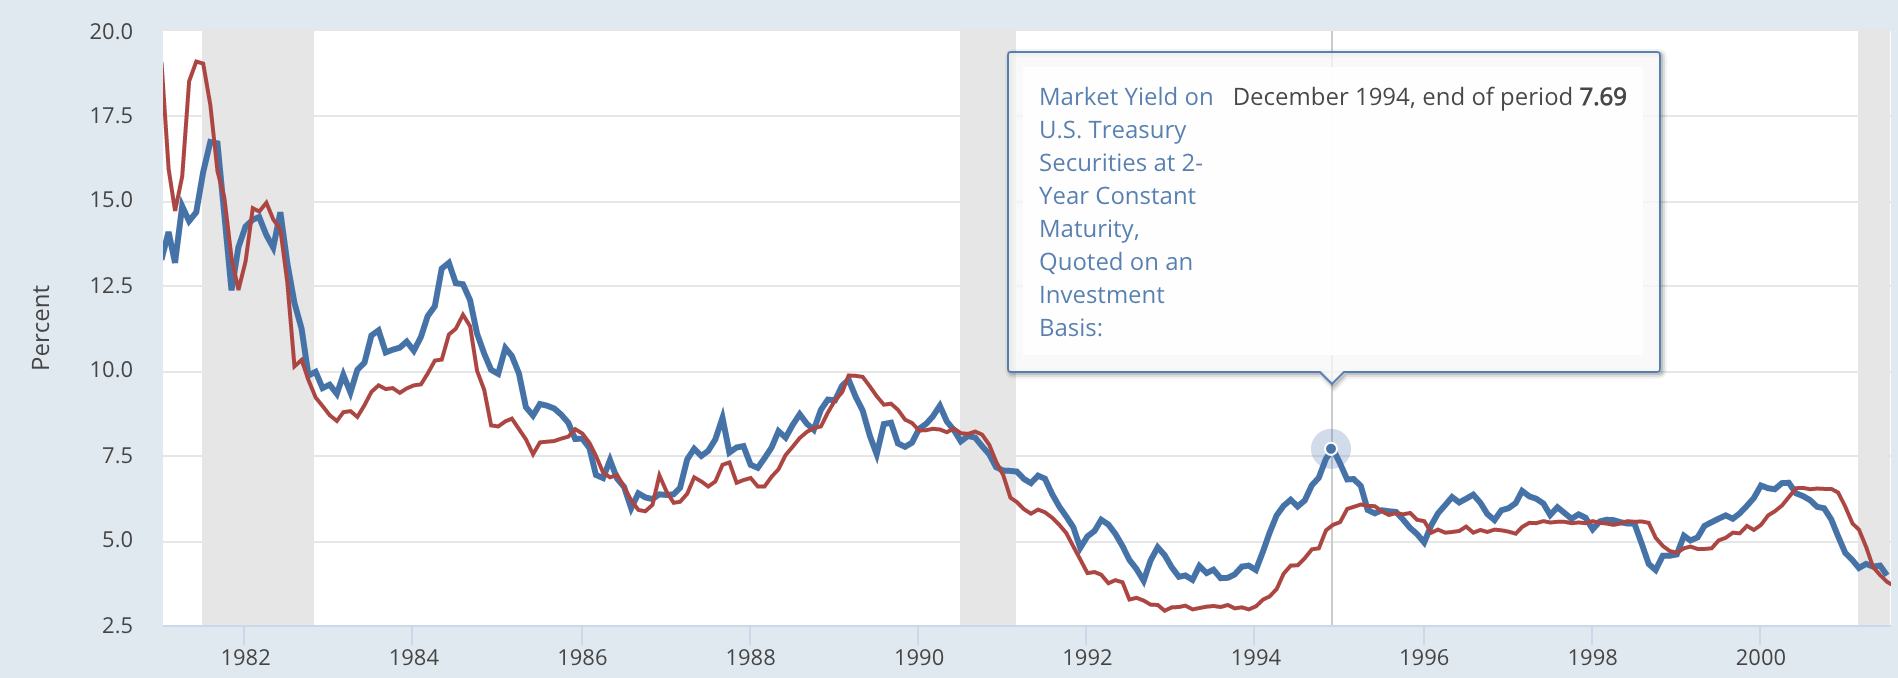
The 2 Year Yield has Always Been a Predictor of Future Federal Funds Rate
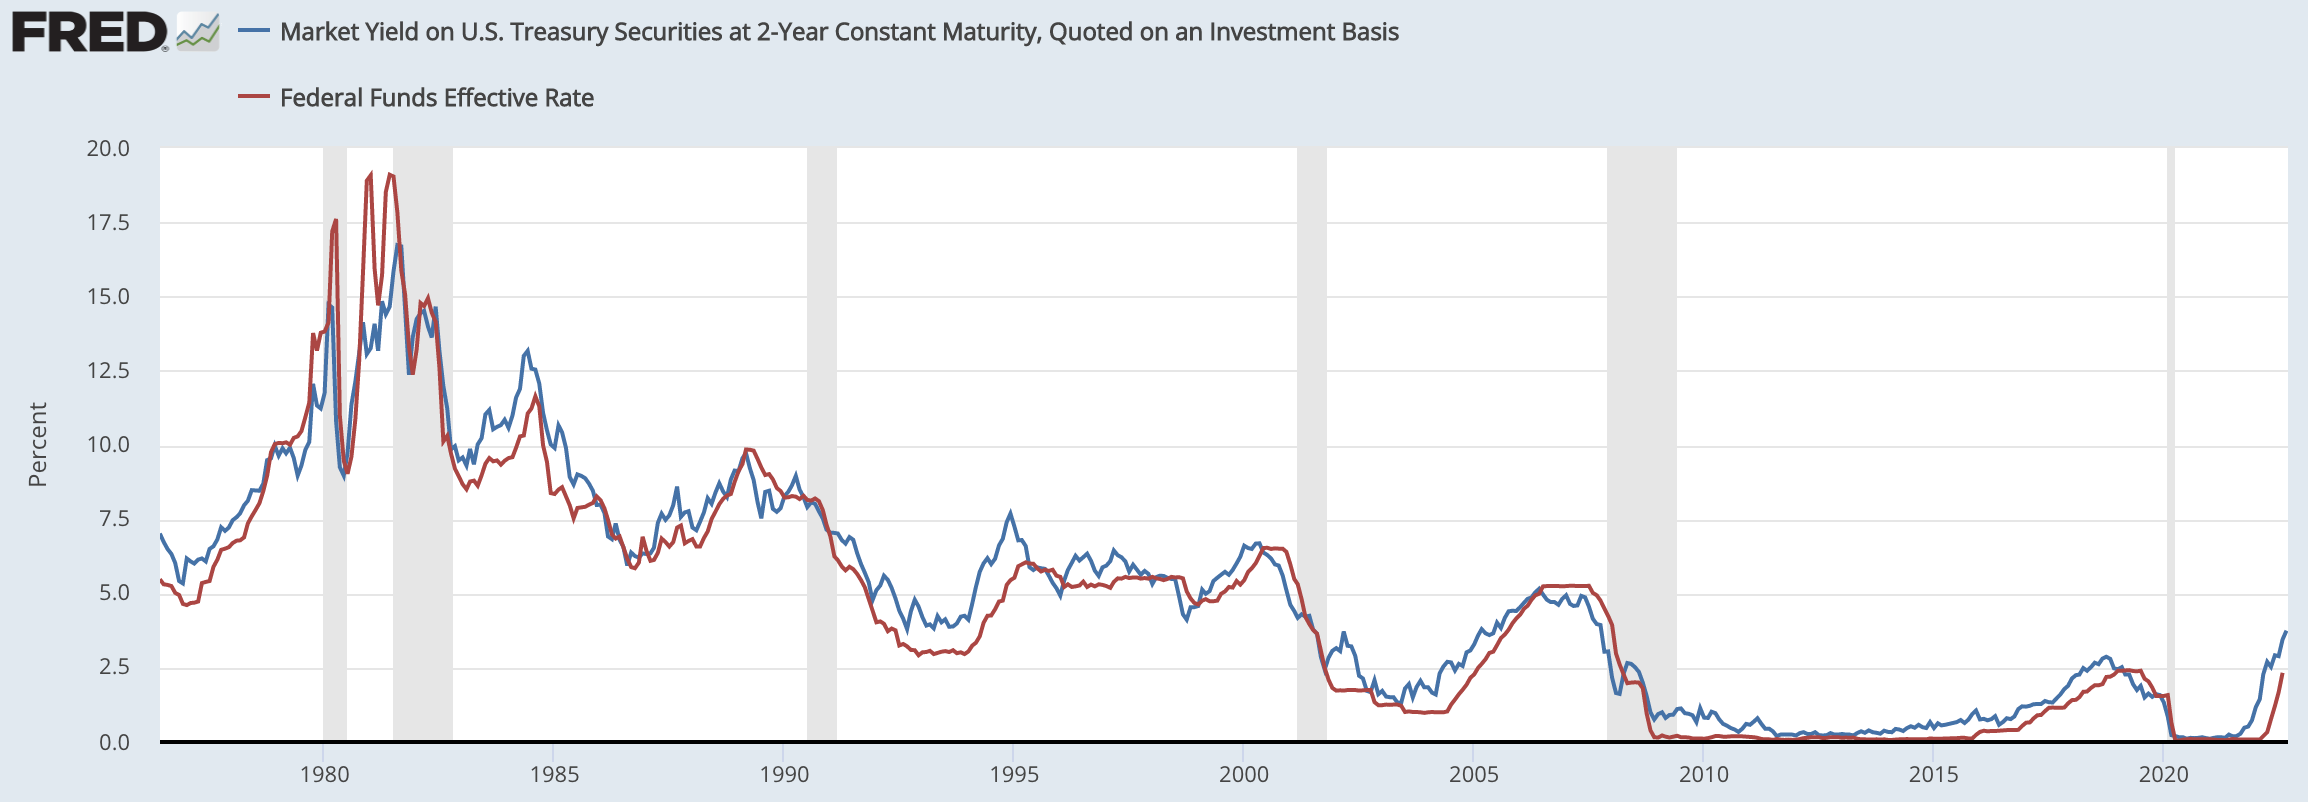
We can go back to the 1970’s and see that the 2 year yield (blue) leads the Federal Funds Rate (red). This correlation is so close that the deviation is hardly noticeable when you put the two on top of each other (image above). Except, there’s something that we can quickly notice. The two year yield is trading meaningfully higher than the current Fed Funds Rate today. There are two other times in history this bifurcation was so high:
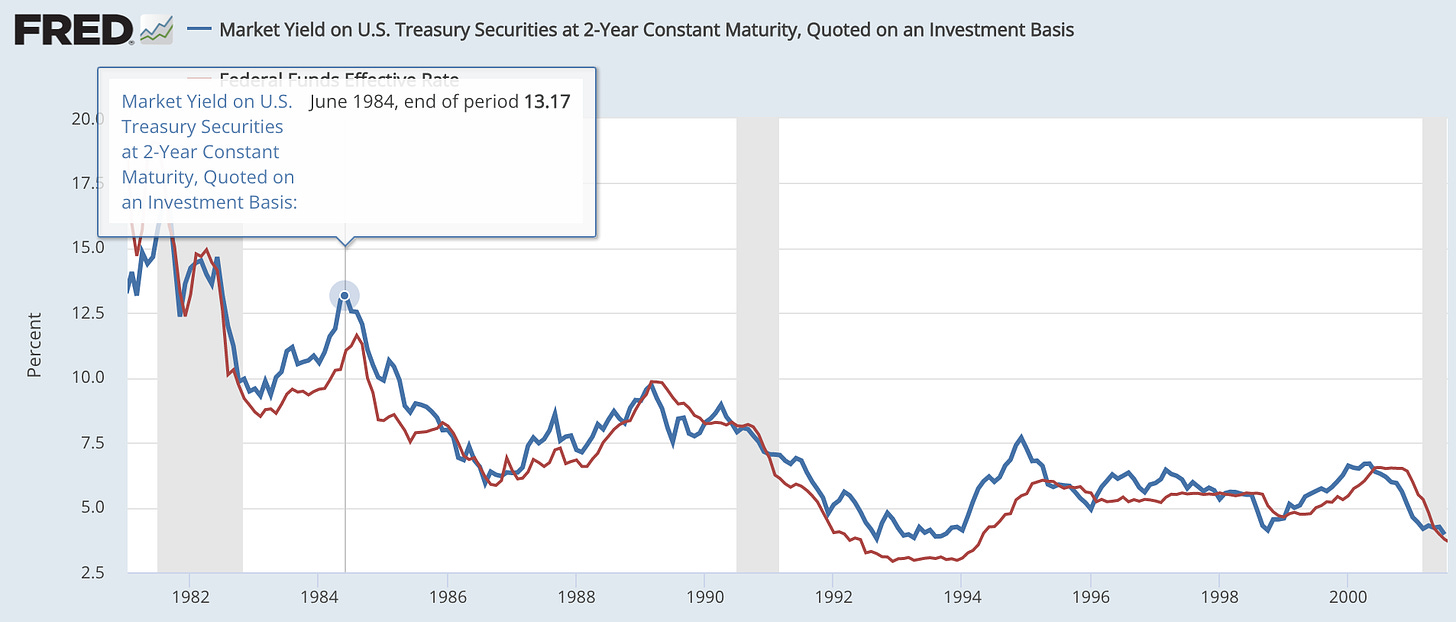
June, 1984
December, 1994
So What Happened to the S&P on These Dates the 2 Year Yield Reversed?
June 1994

December 1994
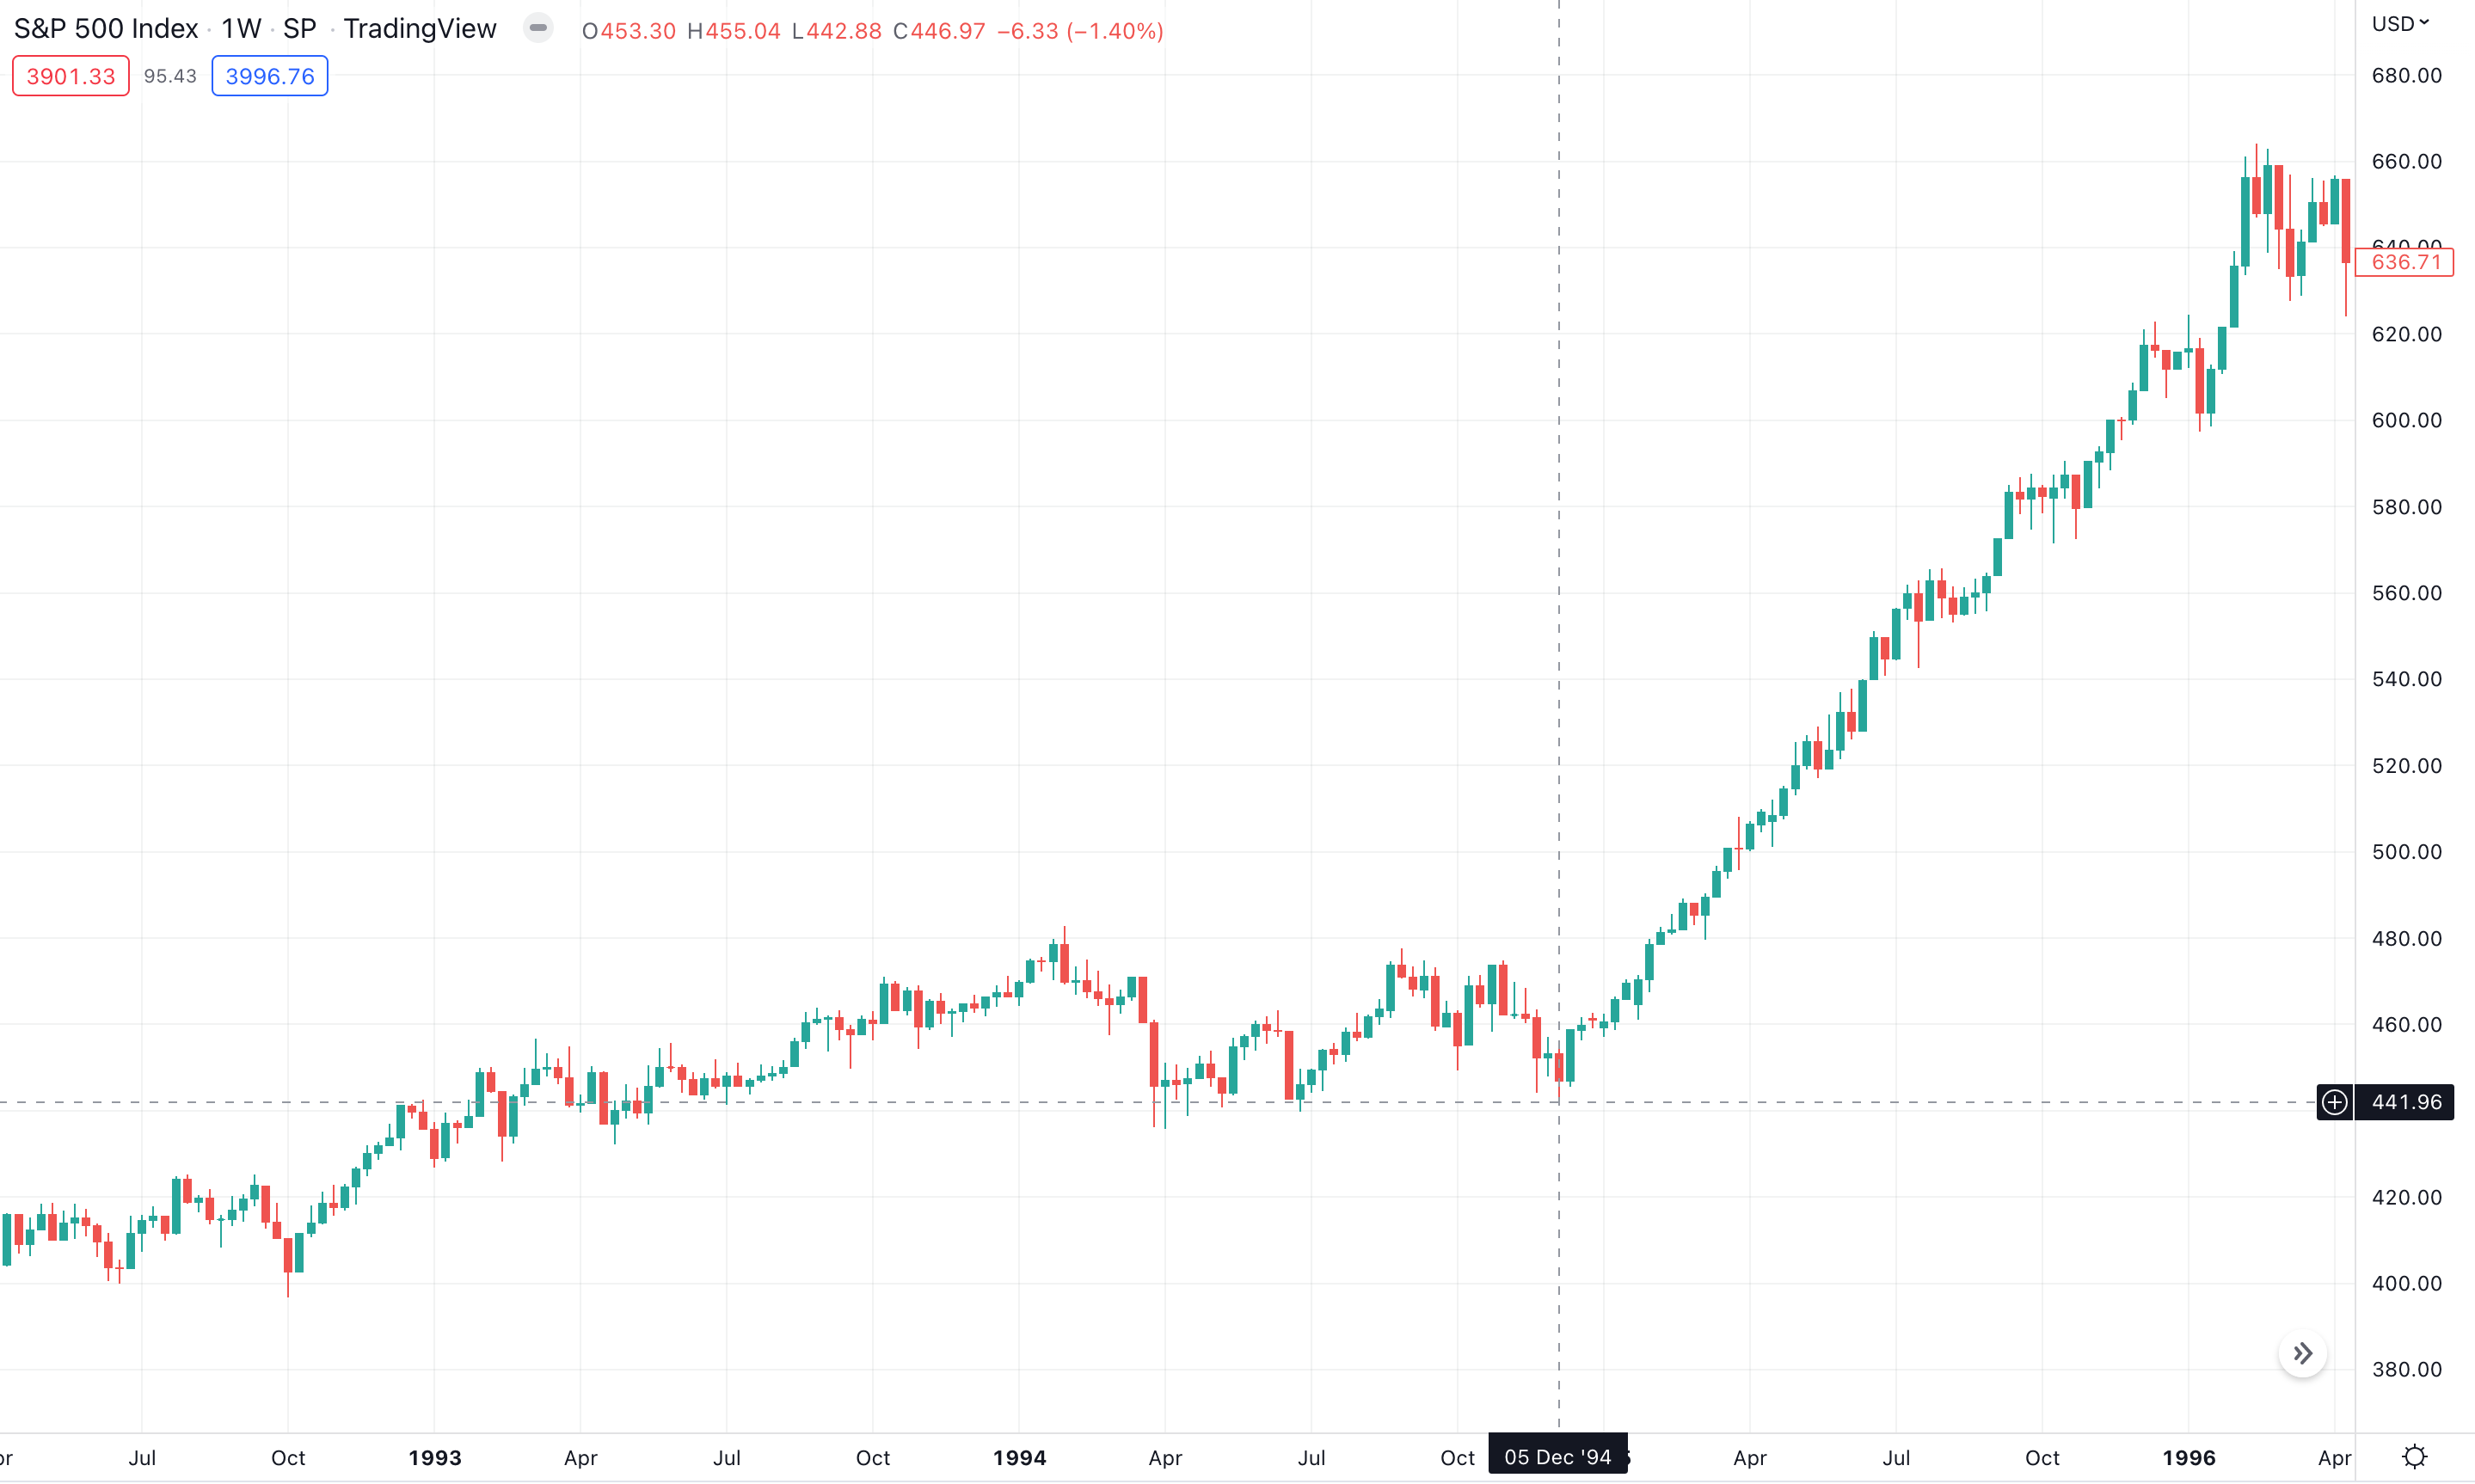
There is no better predictor of the future than the lessons learned of the past.
The Downside Opportunity
The downside is just not there today and it wont be in the short term. Unless 2 things happen:
Jerome Powell goes crazy and Paul Volker’s us by hiking the Federal Funds rate to 8% in the next meeting. This is unlikely as he is more likely to follow what the bond markets are telling him.
In this upcoming earnings season corporate profits are significantly down and the forward guidance is extremely rough.
Effectively this means that this upcoming earnings season, Jerome Powell’s sanity, and the progression of inflation will be what determines the future price action of the markets over the next 3-6 months.
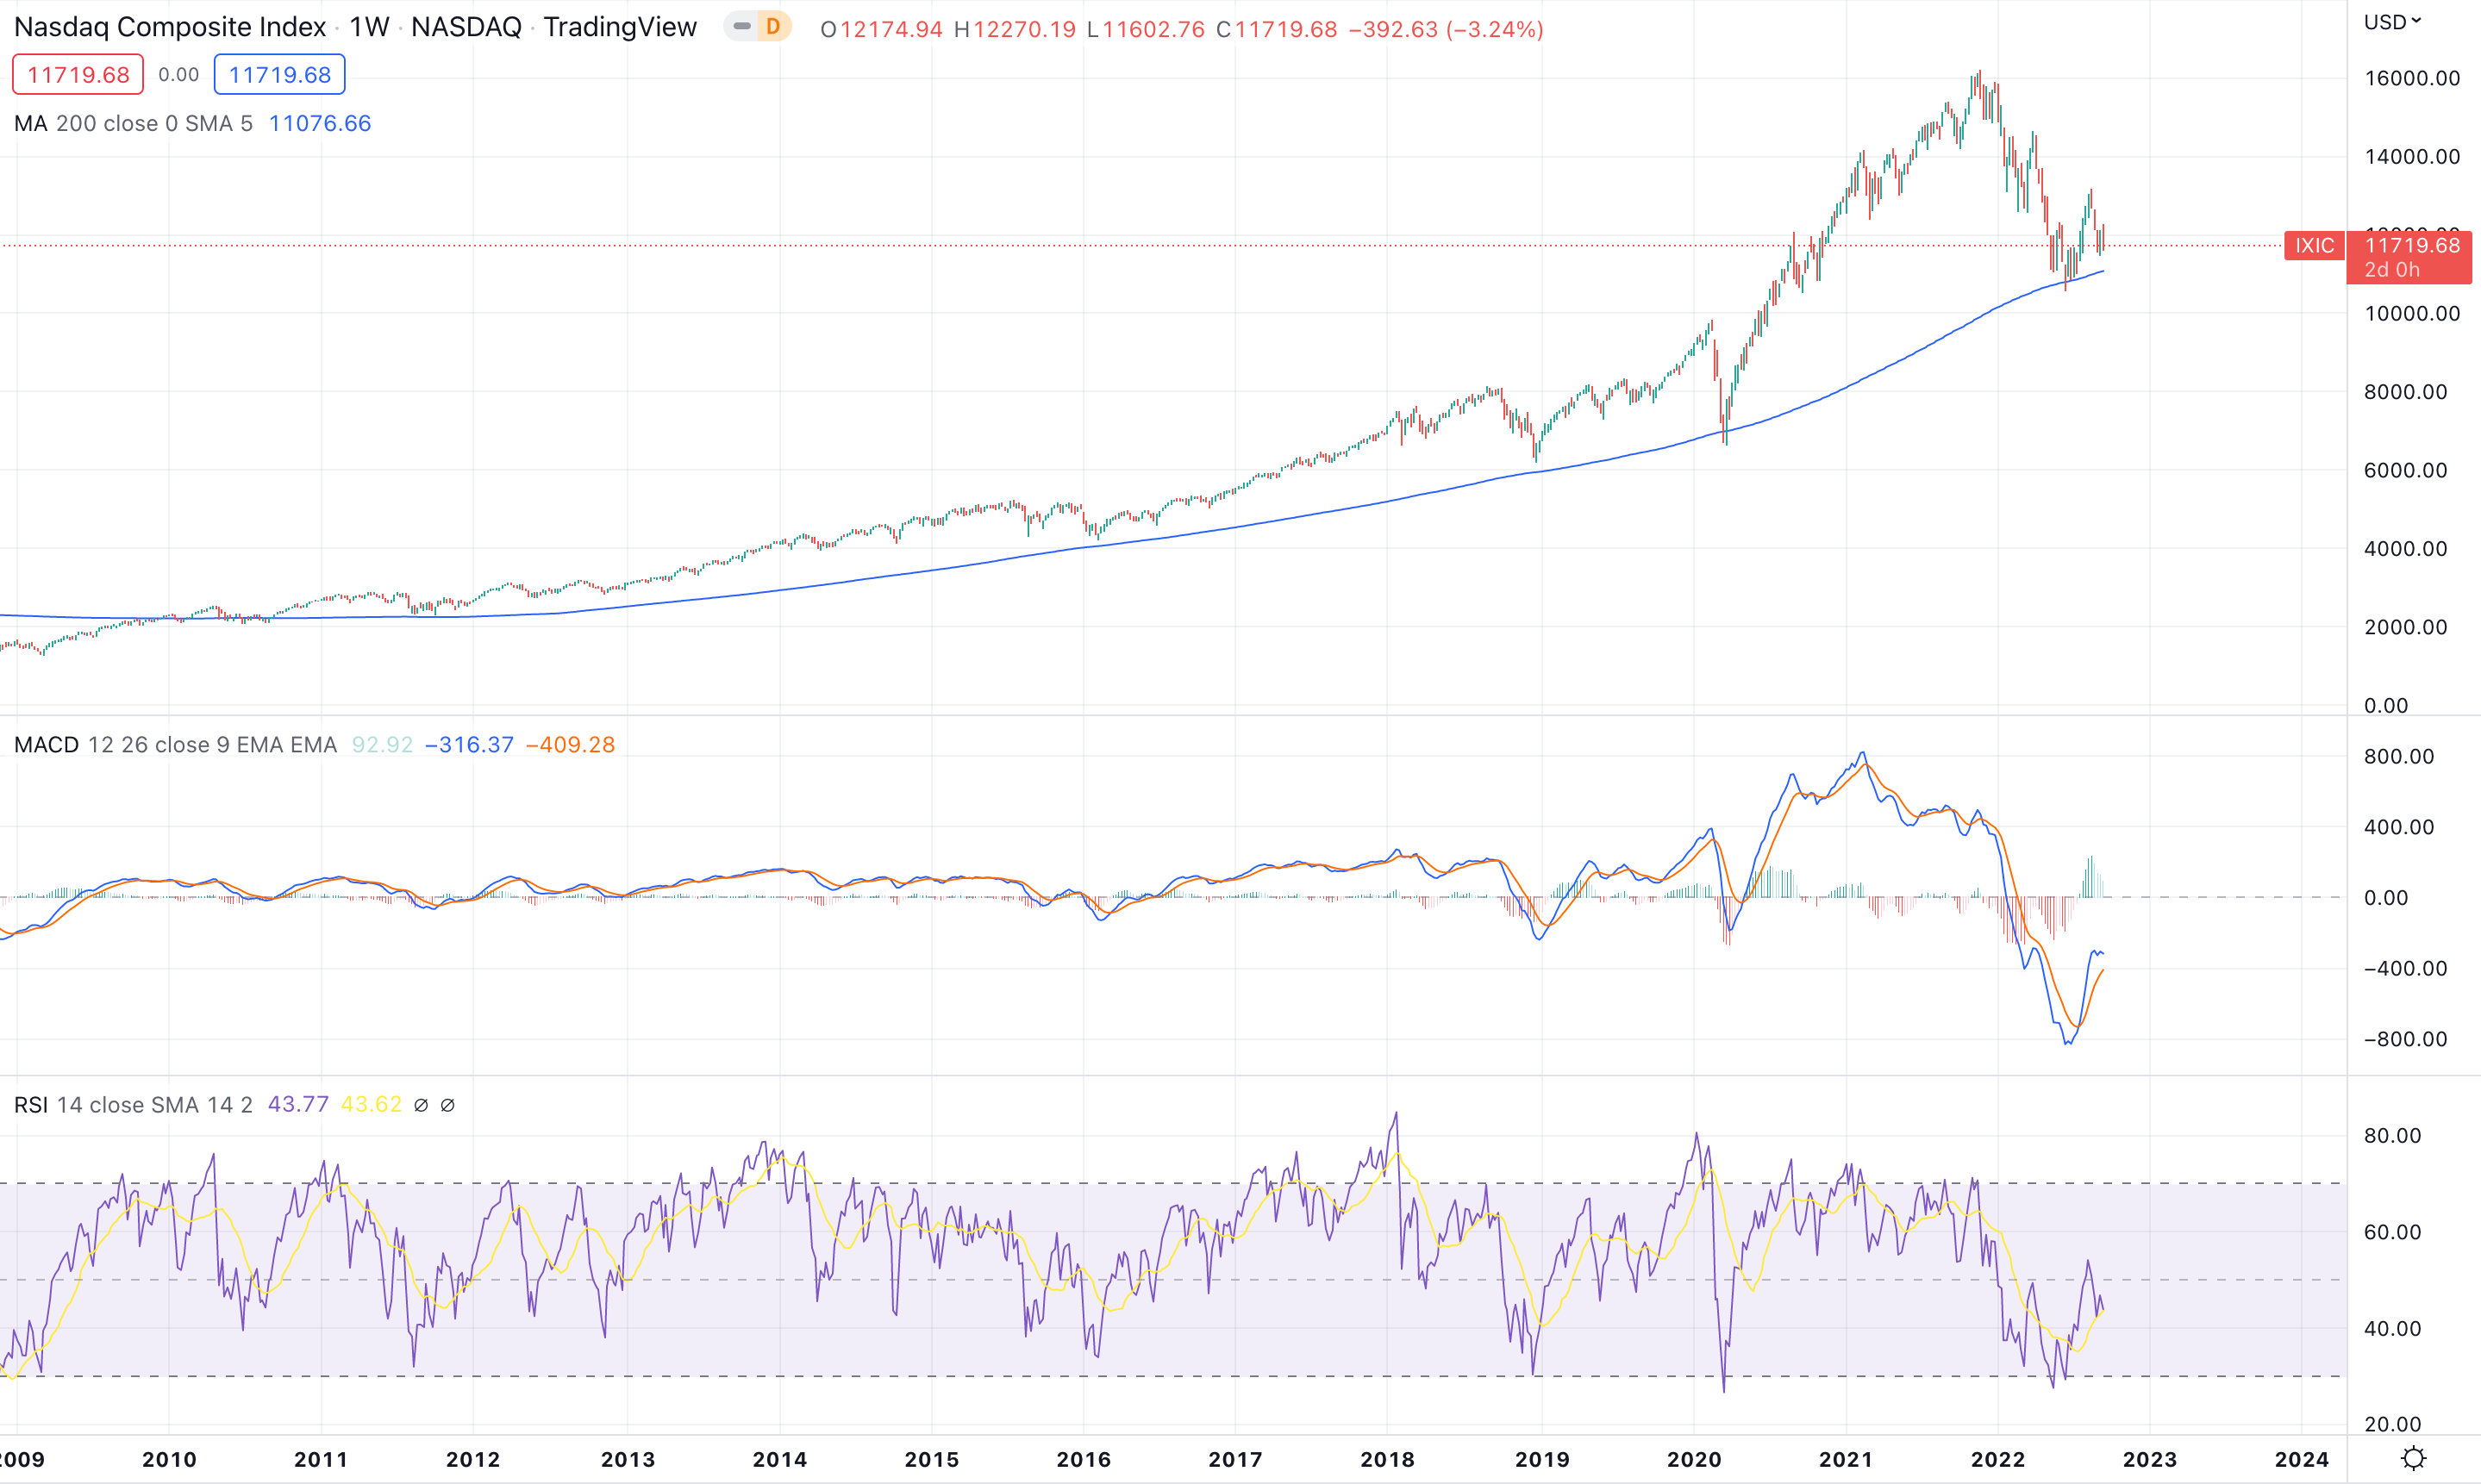
In the short term, it’s just not there either. The markets are clearly in an uptrend on a weekly basis. Without the macro factors I listed above, the ongoing secular bull market will continue. On a shorter term basis, we are forming a bullish technical structure.
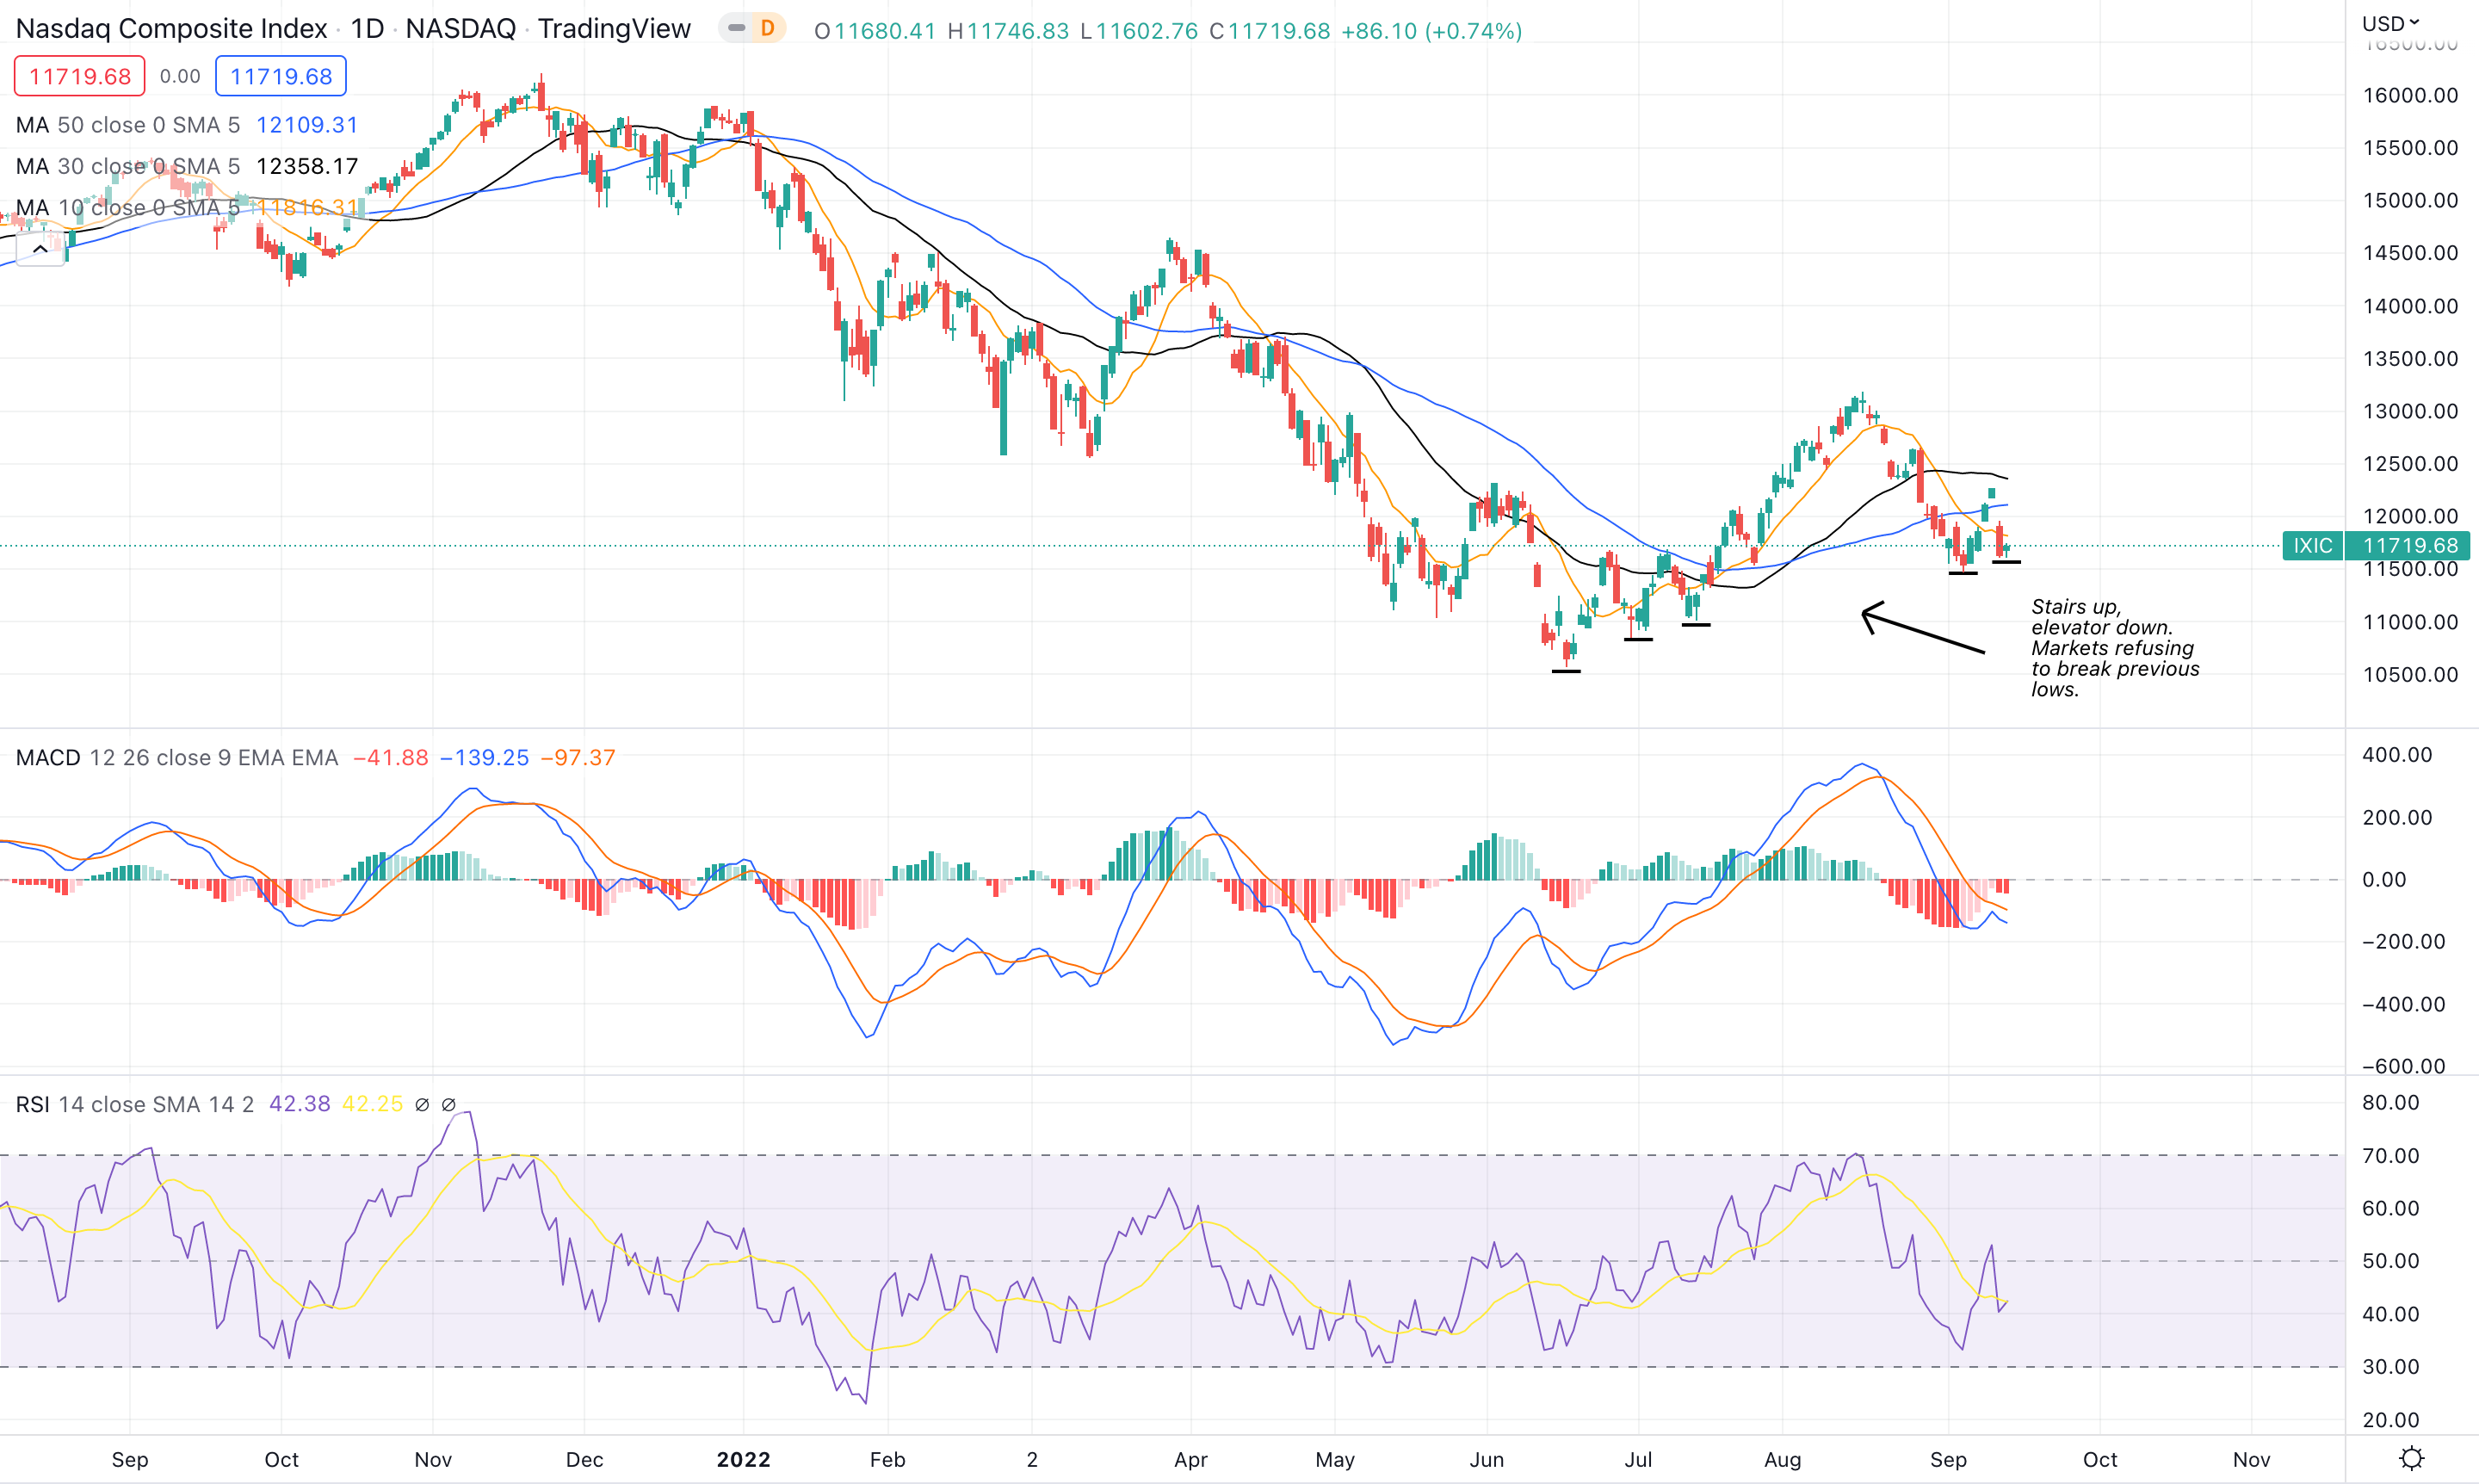
On the chart above I put in little black lines that represented previous lows. It seems fairly obvious that moving averages, RSI and MACD are all over the place. In fact, I debated on not even including this data point but I needed to emphasize how important the structure of a market is and how powerful it can become in moments of trend break down. In this case those little black lines are representing multiple higher lows forming. The market has refused to cut below any of them. This is a bullish development.
From Macro, to Fundamental, Wrapping it Up With Technical, There is No Short Opportunity Today.
Market’s Likely to go Higher.
Stay Tuned, Stay Classy
Dillon
Nice work, compadre. I seriously do not want to get Paul Volcker'd. Sounds unpleasant. ;)
Although it's fun to try and predict what the markets will do in the face of uncertainty, it really only makes sense to follow the price action and react. Time and time again, the market does what people least expect. I'm of the opinion that while history is a valuable tool, we're also in a new age of heavy government/FED intervention via QE/QT. It's makes for some challenging comparisons. Like you said before, we're all part of one giant market experiment, and COVID poured gasoline on that fire.
Enjoyed the read and well explained, as you know my Substack takes the opposite view hehe, but I think this time is indeed different because of $9 trillion QE, it’s what made 2020 bull market so unique and insane, a one in a lifetime market, so if that is the case, then I would believe the opposite is true when they *attempt* to unwind it all via QT (which will break something then we’re back to QE and inflating asset prices again)