
Portfolio Update: It's a Make or Break Moment
Portfolio Update: It's a Make or Break Moment
A sharp pull back on Friday's OpEx (Options Expiration) has many questioning, is the bull rally over?

The Fed minutes came out this last week, which is important, because we are going to get a continuation of the ongoing data set that is “Fed Speak”. This week, we are looking forward to a few major market moving Catalysts:
PCE (Personal Consumption Expenditure) data - which is more inflation data
Jackson Hole, which Jerome Powell will be sharing his thoughts about Fed policy moving forward and his interpretation of the economic data we have seen so far
Jackson Hole in particular is of importance because there is no FOMC meeting in August (the next will be in September) but it can still move markets and can be just as important as an FOMC meeting. In this case, we are going to be watching exactly what he says and how the bond market responds. The response of the bond market will be crucial in gauging exactly how the equity markets will move for the rest of the year.

The Next Few Weeks Confirm if this Was Only a “Bear Market Rally” or, a Major Reversal
In this NewsLetter, we are going to build on what was said earlier in the week with our interpretation of the Fed Minutes and translate it to what we are looking for during Jackson Hole, on Friday. If you missed the Fed Minutes publication, you can find that here:
In addition, we are going to spend time examining the technicals of the market, which we think of are of particular importance of recent. In the next 2-3 weeks we will get confirmation of trend (either up or another leg down), I will show you what we are looking at for this confirmation. The technical pattern set within this next 2-3 weeks will be very influential on the rest of the year.
At the End of the Publication I Will Provide a Portfolio Update and My Expected Moves from What I am Seeing.
From a Technical Perspective, it is Make or Break

It was not difficult to know that we were at a point where a pull back was necessary. Meme stocks began running again (almost always the tell tale sign of a top) and we were over bought on a daily basis. Let me show you exactly what I was seeing here.
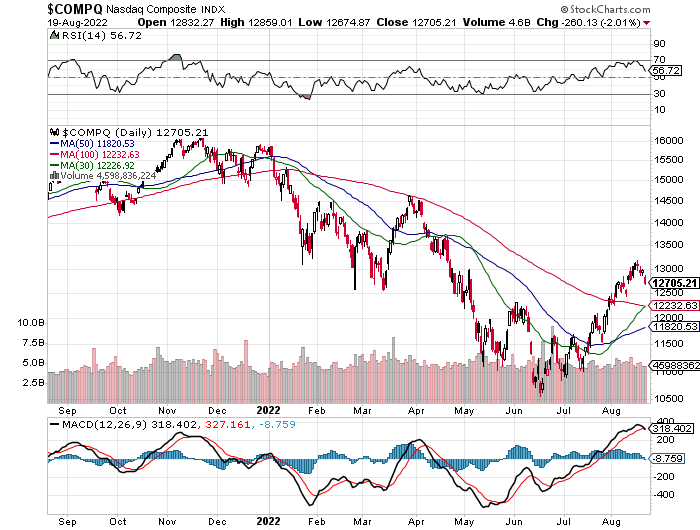
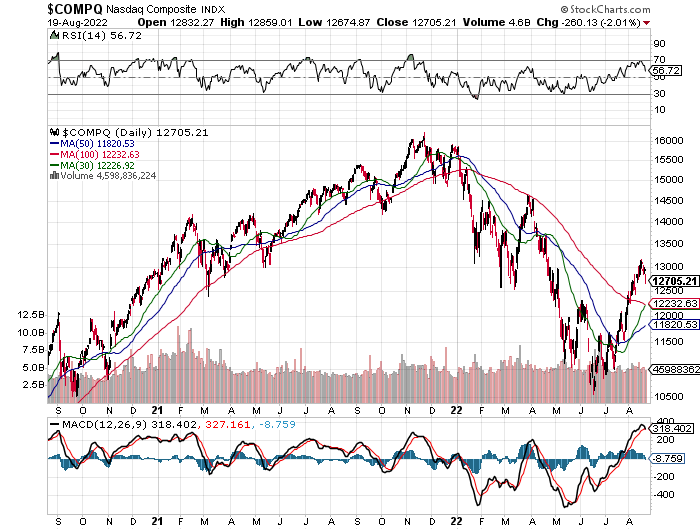
There are three specific data points I was seeing, on a daily chart, that showed me it was time to pull back.
We became extremely over extended from the 30 day and 50 day moving average. Usually healthy bull markets climb the 30/50 day moving average with the occasional correction to the 100 day moving average.
The RSI (at the top of the chart) reached over bought levels (on a daily basis, I’ll cover weekly in a moment). Typically when the RSI hits over bought or over sold levels, this justify’s a short term rally or a short time pull back.
The MACD is curling over. In my opinion, this is arguably the most concerning because the last time this happened was in March when the markets fell from 14,500 to 10,500.
When you couple all these technical data points, it was easy to see, that it was necessary and, it was time for a pull back. But, here’s the thing, I think this will act a lot like a correction rather than a full blown leg down. The picture comes more into view when you pull up the weekly chart. Weekly charts usually indicate stronger trends than daily.

There are three important data points to recognize here:
RSI is not over bought and is currently neutral. Typically, bull markets tend to stay above a 50 RSI on a weekly basis.
Weekly MACD curled up, which is usually an indicator to a new bull market. For additional context, below, I market with a black line every time the MACD has curled up since 2007.
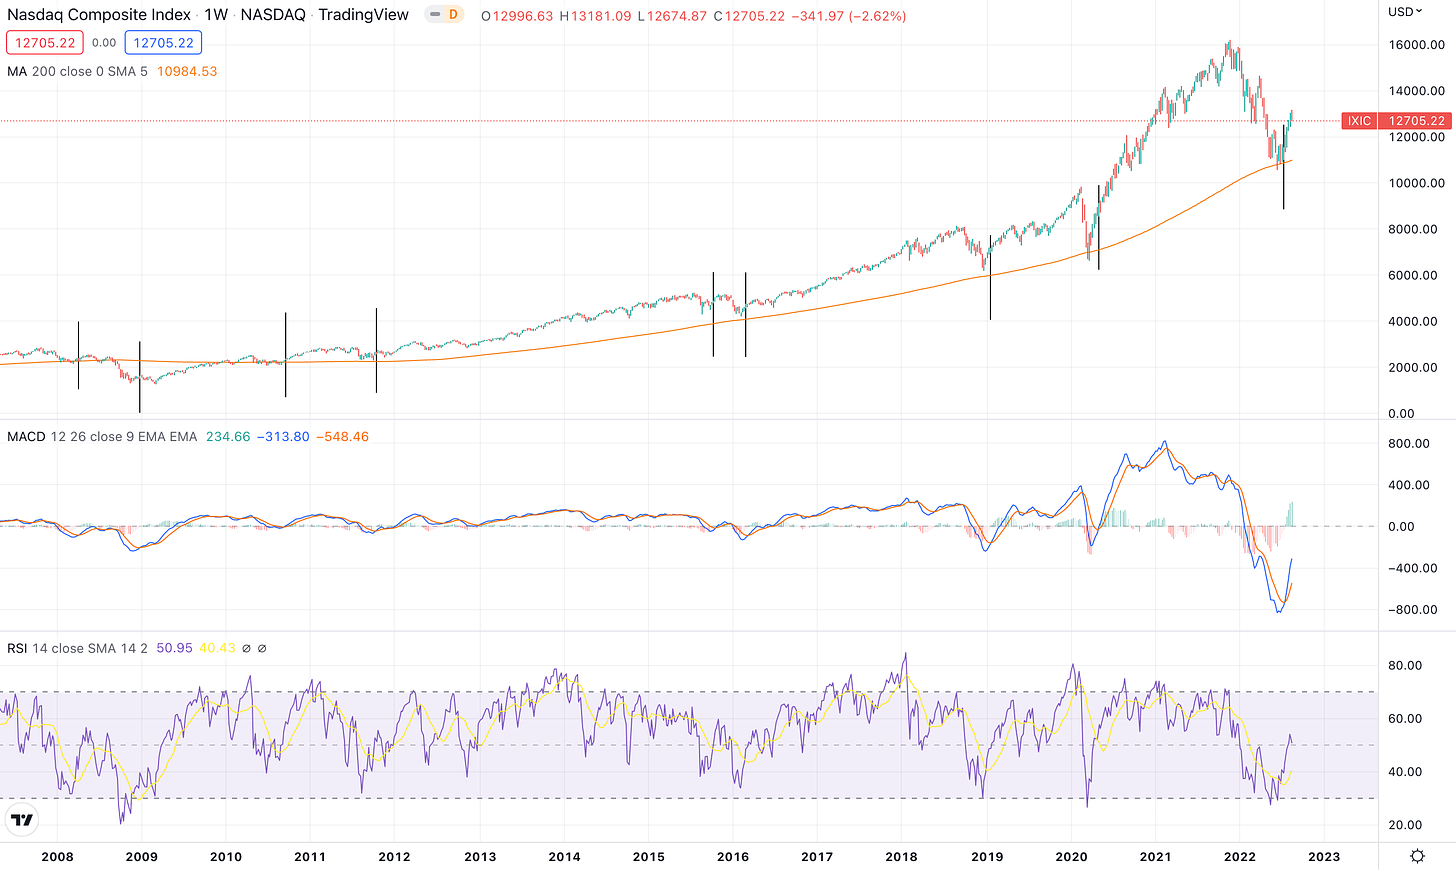
The 30 week moving average did act as support last week, it will be crucial to see if the market breaks this level. It will spell trouble if it does.
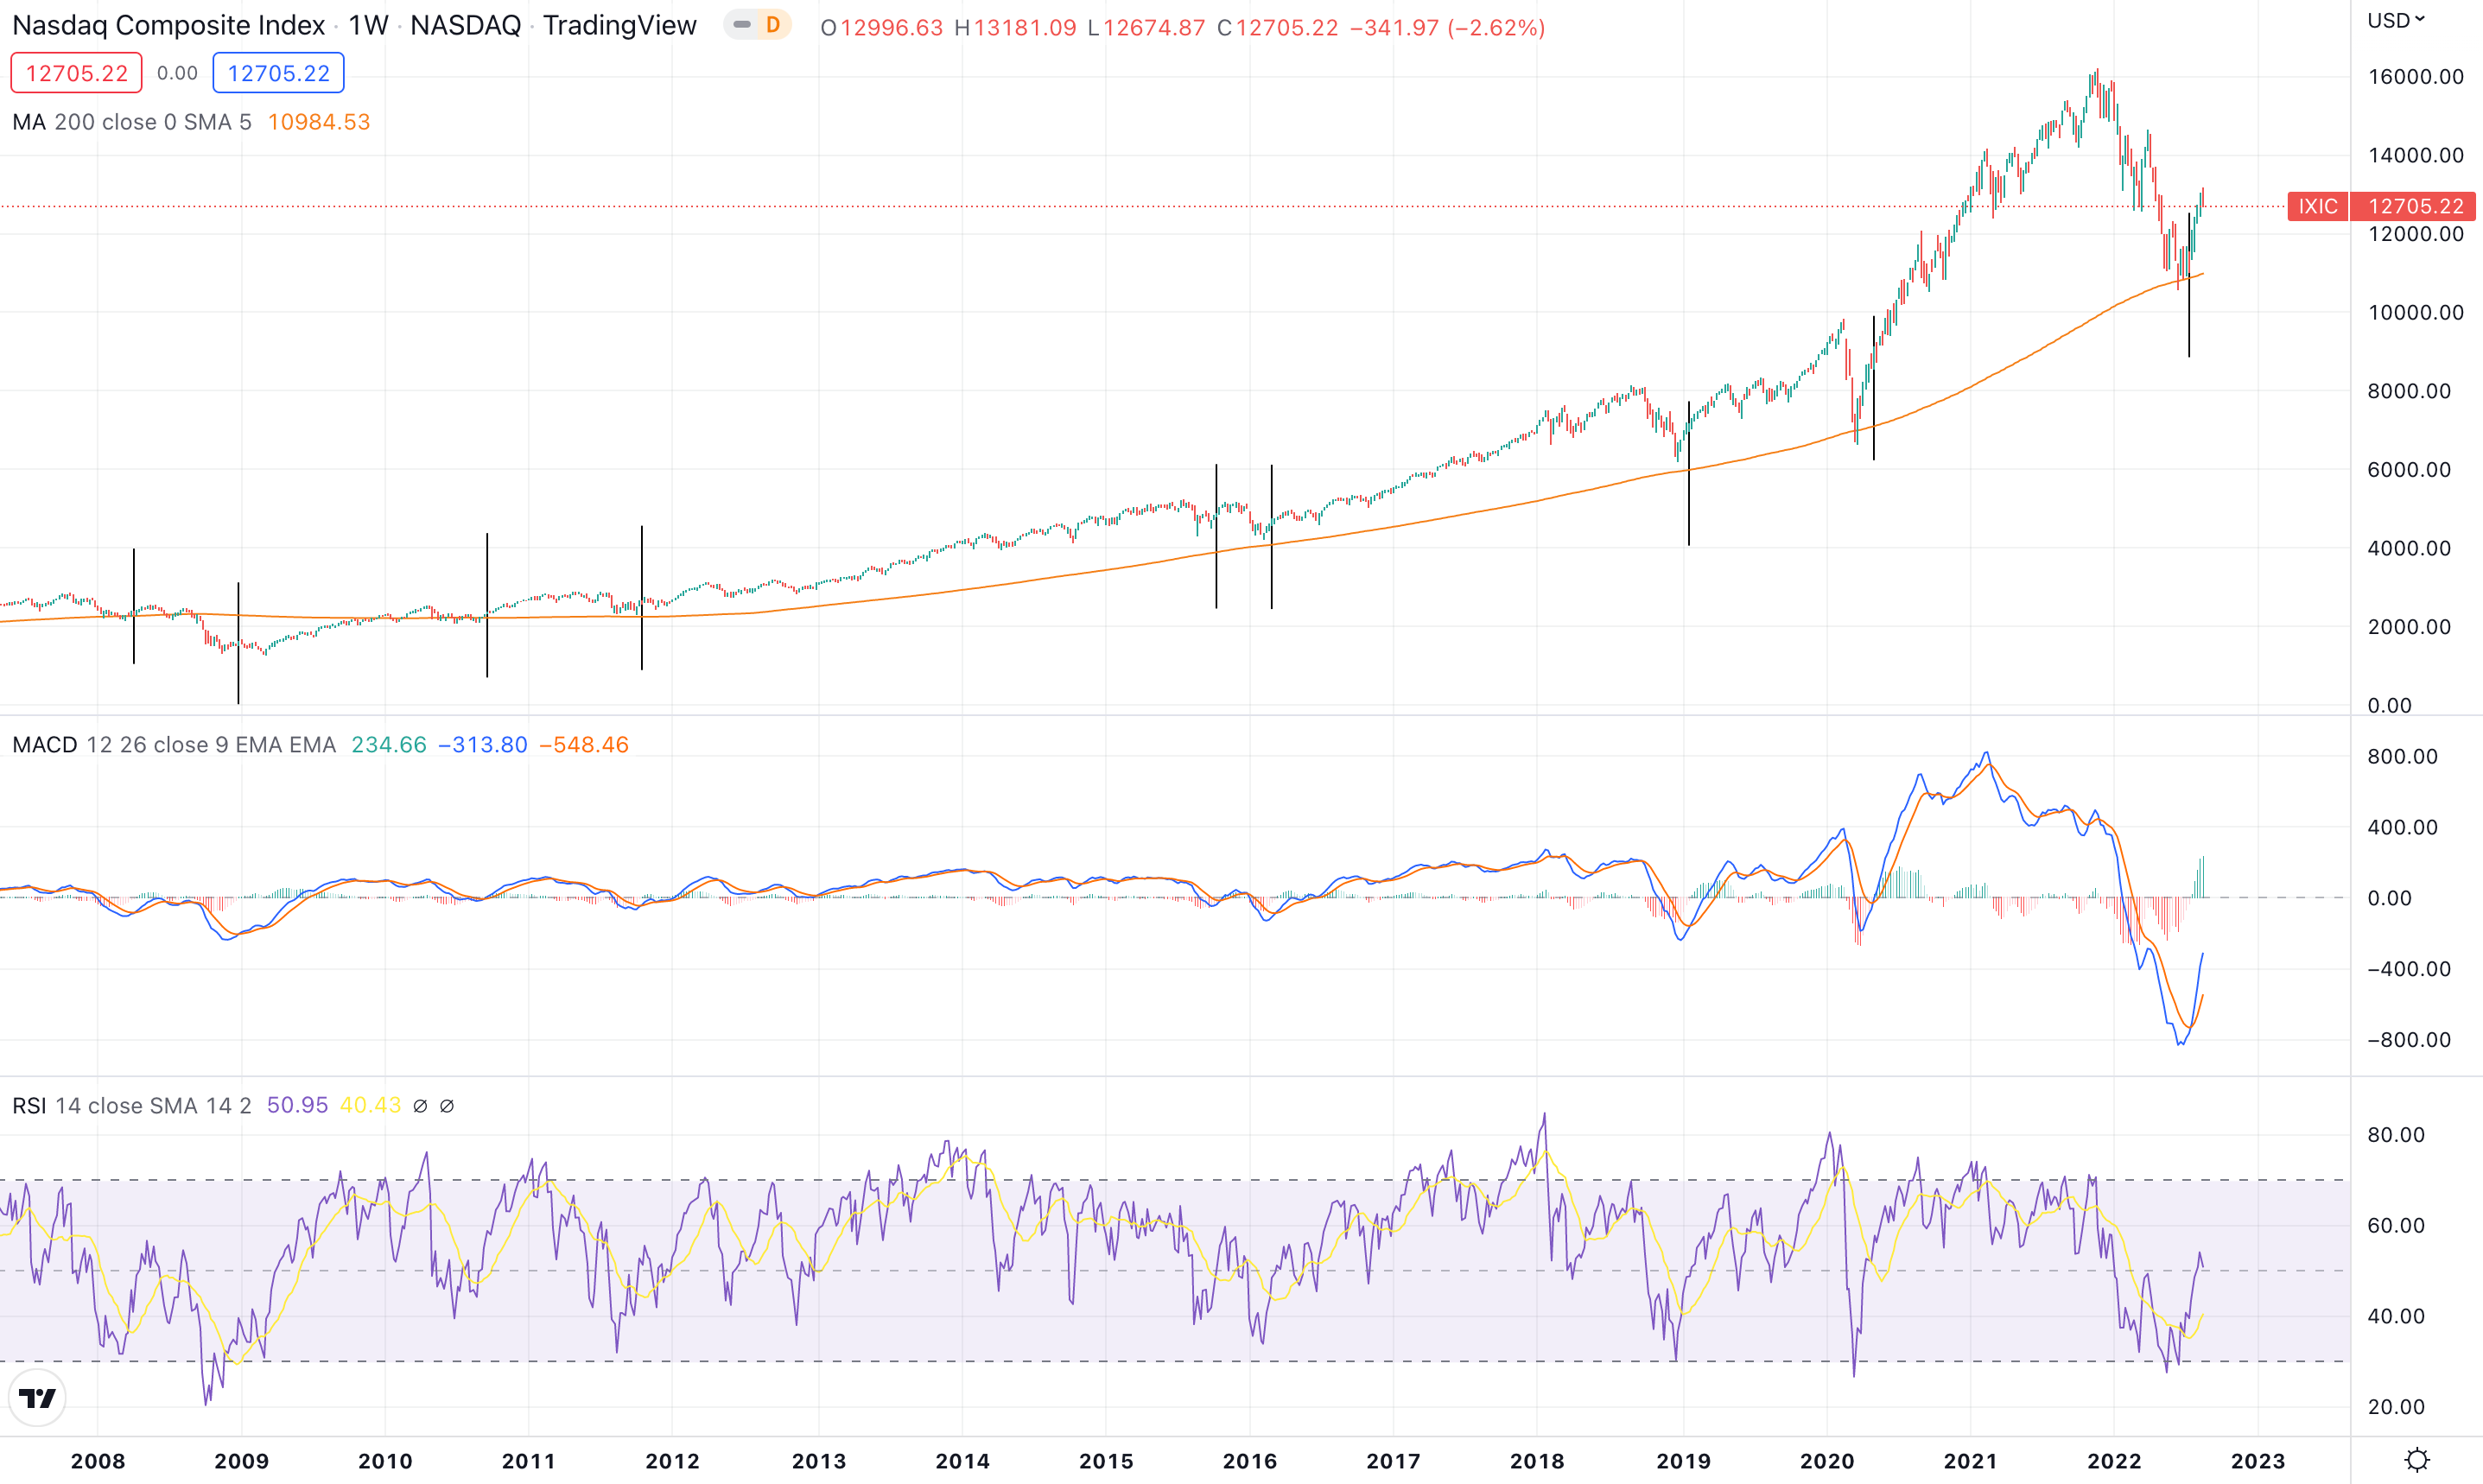
This is what does concern me, when looking at the 50 week and 100 week moving average. A cross down usually spells disaster in the months ahead.
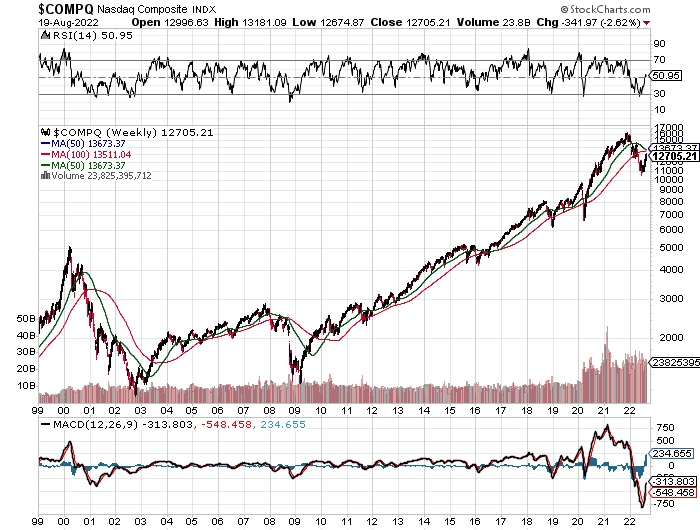
The last time the 50 week has crossed below the 100 week moving average was 2008, where the market continued to decline 30%+. You can see (above) that the crossing of this moving average also market the 2000 market top. When looking at 2015, we saw a similar trajectory but the markets did recover and did not fully cross.
This will be important to continue to monitor over the next few weeks
In Simple, This is What the Data is Telling Me
There are a lot of encouraging signs that tell me the markets have reversed and this is the beginning to a new bullish uptrend. In particular, referencing the daily chart again, it is encouraging to see the 30 and 50 day moving averages curl up. When we observe that the 30 day moving average is about to cross above the 100 day moving average, this is bullish and will certainly act as support at the 12,200 mark.
During bear markets, technicals are usually destroyed and it takes time for them to recover. The V shaped rally we saw during COVID was unique in its own right because of Fed policy response. In this particular instance, technicals are favorable to signal a pull back of 5 - 10% rather than another leg down. This is what I will assume for now, especially if my Macro (Fed Policy) thesis plays out correctly.
Jackson Hole and Jerome Powell
Jackson Hole is an annual gathering where the Fed and policy makers come together to discuss economics and Fed policy. You can read more about here on the Kansas City Fed website:
The importance of this even for investors is centered around Jerome Powells speech that takes place this Friday. We can expect JPow to touch on all the important data points we pay attention to, which include:
Interest Rates
Inflation Outlook
Quantitative Tightening
Recession
Reverse Repo Market and Market Liquidity
I expect to do a more detailed Newsletter covering the findings of this event next weekend but I will emphasize a why this is important to investors and traders.
It the Future Outlook of the Fed’s Tightening Cycle that Matters
Above (at the very top of this newsletter) I linked my midweek memo that goes into detail about what the market expects on a go forward basis. This is important to know/understand when judging exactly how expectations can change. Since market technicals do favor a downward move, this meeting can make or break the rest of the year. This is what we can assume:
If JPow comes out slightly more dovish, or neutral, from existing market expectations we will likely rally further
If JPow signals any more rate hikes, or a more aggressive QT program, than what markets expect, we will dip further
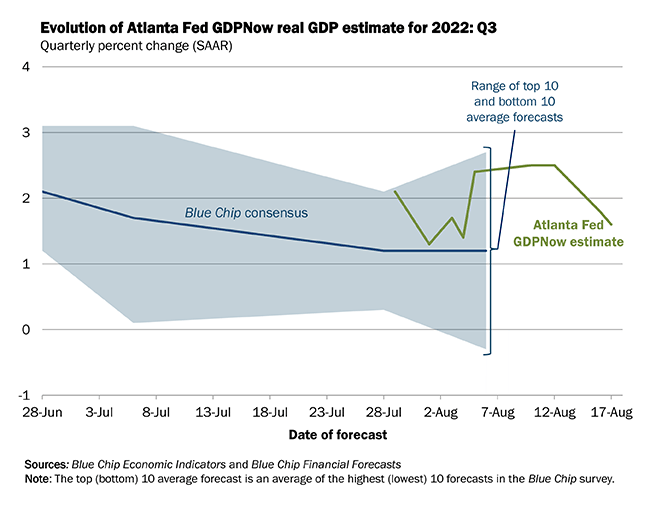
GDP already contracted two consecutive quarters in a row (indicating a recession). Fears of a more prolonged recession will begin to take the narrative if monetary policy is tightened further. Below, I brought up how I think Q3 GDP will actually be above 0%, which will curb the recession narrative.
GDP Now from the Atlanta Fed currently agrees with this hypothesis
It is All About the Credit Markets
Credit growth drives economic growth and if the Fed tightens further with either using the Federal Funds rate, or their credibility (meaning market tightens for them), we can expect more pain ahead because this will put us into an earnings recession coupled with further multiple compression.
If I had to Make a Guess on the Future of Policy
It’s important to clarify why I do these NewsLetters. It’s is to provide context on the why markets are moving and what they are going to do with the existing data. But the data itself is extremely volatile. Inflation could go up, it could go down. What ever inflation does is what the Fed will do in response. Let me say that absolutely nobody can 100% predict what is going to happen with inflation or interest rate policy in response. We can make really good guesses, nothing more.
My educated guess is that inflation will go down because economic growth has been slowed and did slow meaningfully. In addition, the Federal Reserve adjusted the market rate (before the Federal Funds rate) of the 10 year and 2 year yield to be above their “estimate” of neutral. When you raise interest rates above neutral, this behaves much like driving a vehicle. Let me explain:
Pretend like we are driving a car, the speed limit is 60 mph, and you have it on cruise control at 60 mph, but you sped your vehicle up to be around 80 mph. To get back to the speed limit you want to be at, you put on the breaks to get back to where you’re supposed to be. 60 mph is the where the car should be since that’s what cruise control is set at. However, when we push on the gas pedal it goes faster (if we lower interest rates too far this is like pressing on the gas pedal). When we press the break, we slow down (this acts a lot like raising interest rates above neutral).
My opinion aside, if we look at the market expectations, future expected inflation is anchored to historically normal levels and is not rising meaningfully.
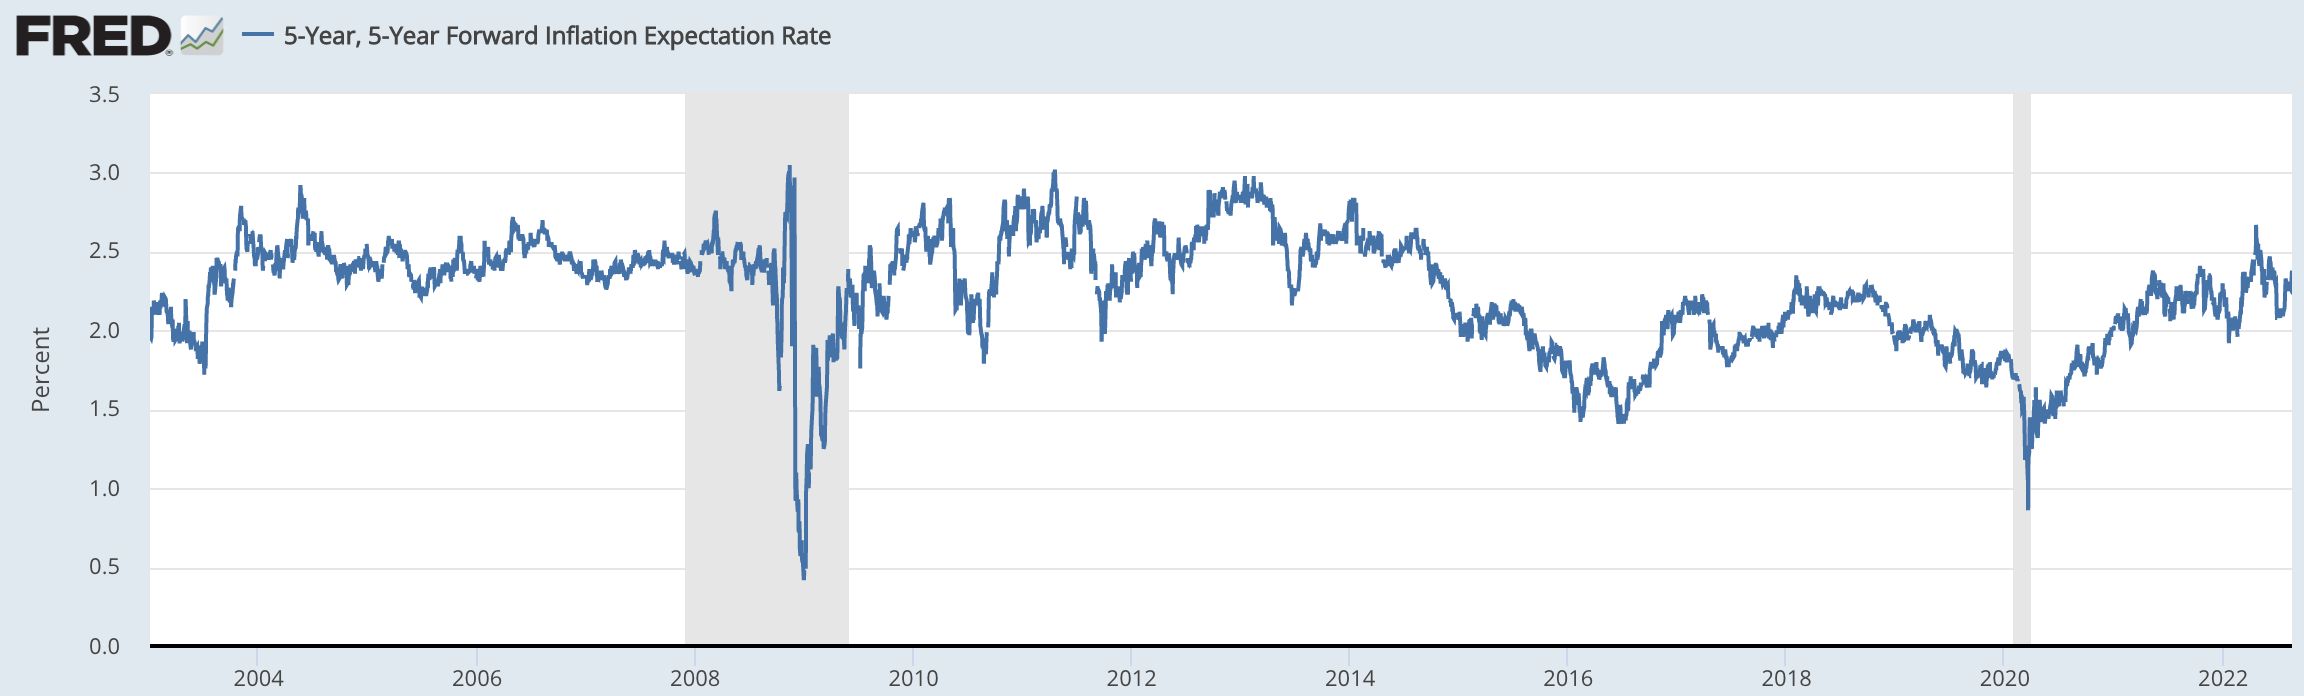
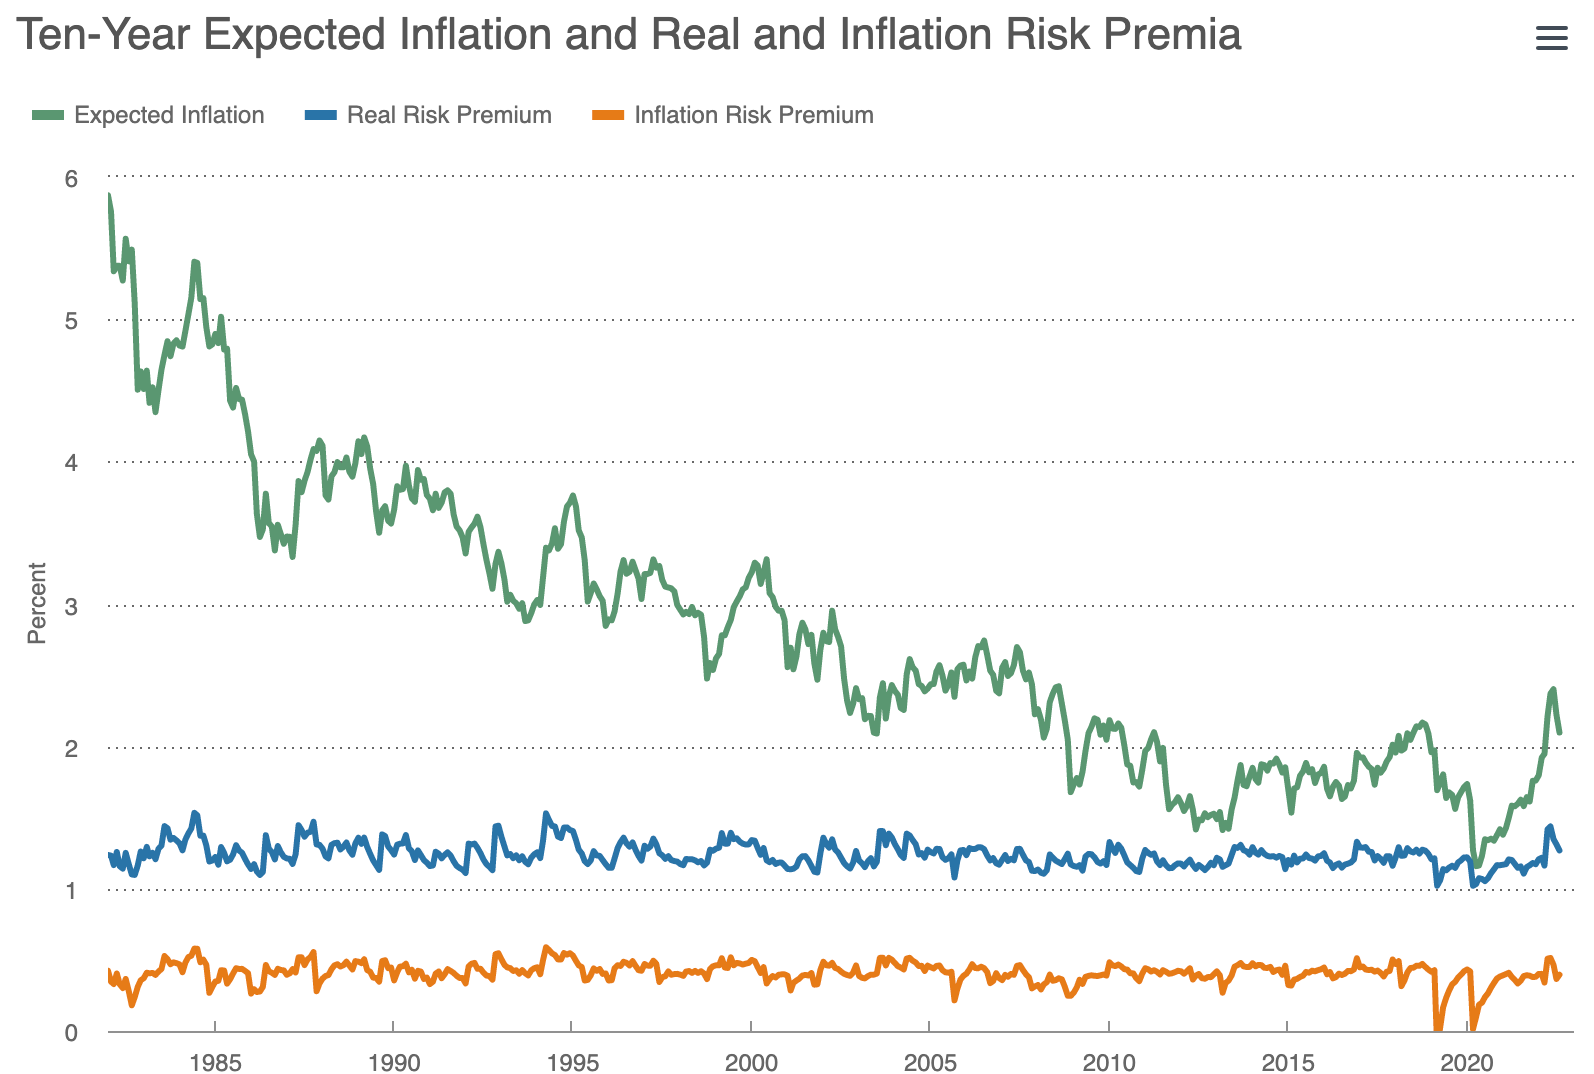
I still believe that peak hawkish expectations are behind us and that inflation will come down meaningfully in the months ahead. This will support a market rally.
My Portfolio and Expected Moves to be Made
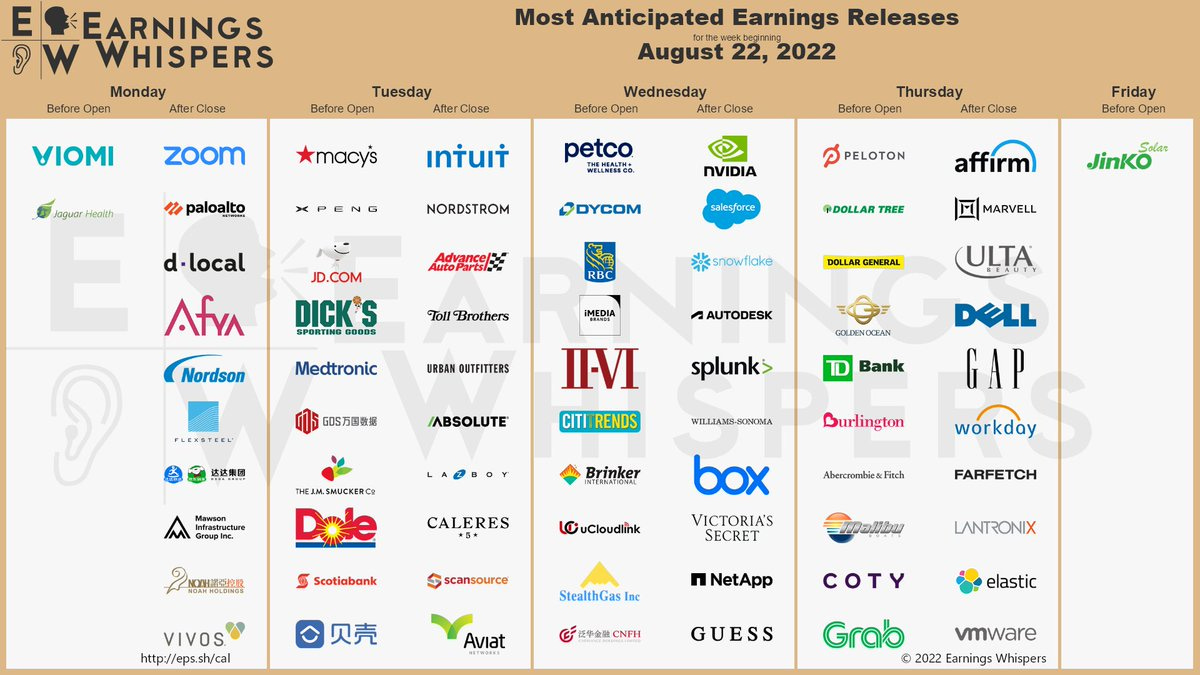
First, I have to mention earnings for a few of my companies this week!
Keep reading with a 7-day free trial
Subscribe to BluSuit to keep reading this post and get 7 days of free access to the full post archives.