
Portfolio Update: Nothing Else Matters but Macro?
Portfolio Update: Nothing Else Matters but Macro?
Inflation, Bank Earnings, "Earnings Recession" and Earnings Season

I talk, almost every day, about the market cycle and where we are in the process. This is extremely important to understand, even as a “long term” investor. It helps us manage risk by finding opportunistic shorts or to look in the area of the market that others may completely over look because of what “might” happen over the next 6-12 months. Today, the current cyclical market cycle has never been more important since 2008/09. Investors are smart to understand the credit markets and understand how it may effect their individual investments.

In this publication, I am going to cover:
Inflation came in worse than expected, but the markets didn’t move, why?
The Federal Reserve’s hiking cycle and what the bond market is telling us
Upcoming earnings, the implications/importance, and a few individual businesses I am watching
My portfolio and updates I have made
Inflation Data Came Out, It Was Bad
I don’t believe I was the only one who quickly noticed that the markets hardly moved this week despite inflation data being terrible. In addition, did anyone notice how JP Morgan’s earnings came out, they missed on everything, and the stock finished flat on the week?
We need to have a good look at where the markets are today and understand exactly what is “priced in” to the markets. See, what narrative often overlooks is how the news today is commonly priced in and the jiggles in the market are actually fluctuations of future expectations. When thinking of the future, what is priced in?
1.) a Mild/Moderate Recession
Stepping away from what I see on Twitter everyday, where nearly everyone is saying “wait till the earnings recession” (this is essentially a decline in the forward P/E of the markets) I can confidently come to the conclusion that a mild/moderate recession is and has been priced into the markets. Anyone who manages money profession (who really control the markets) understands that credit growth is detrimental to economic growth. The bond market in this case is largely a leading indicator of economic stimulation and contraction
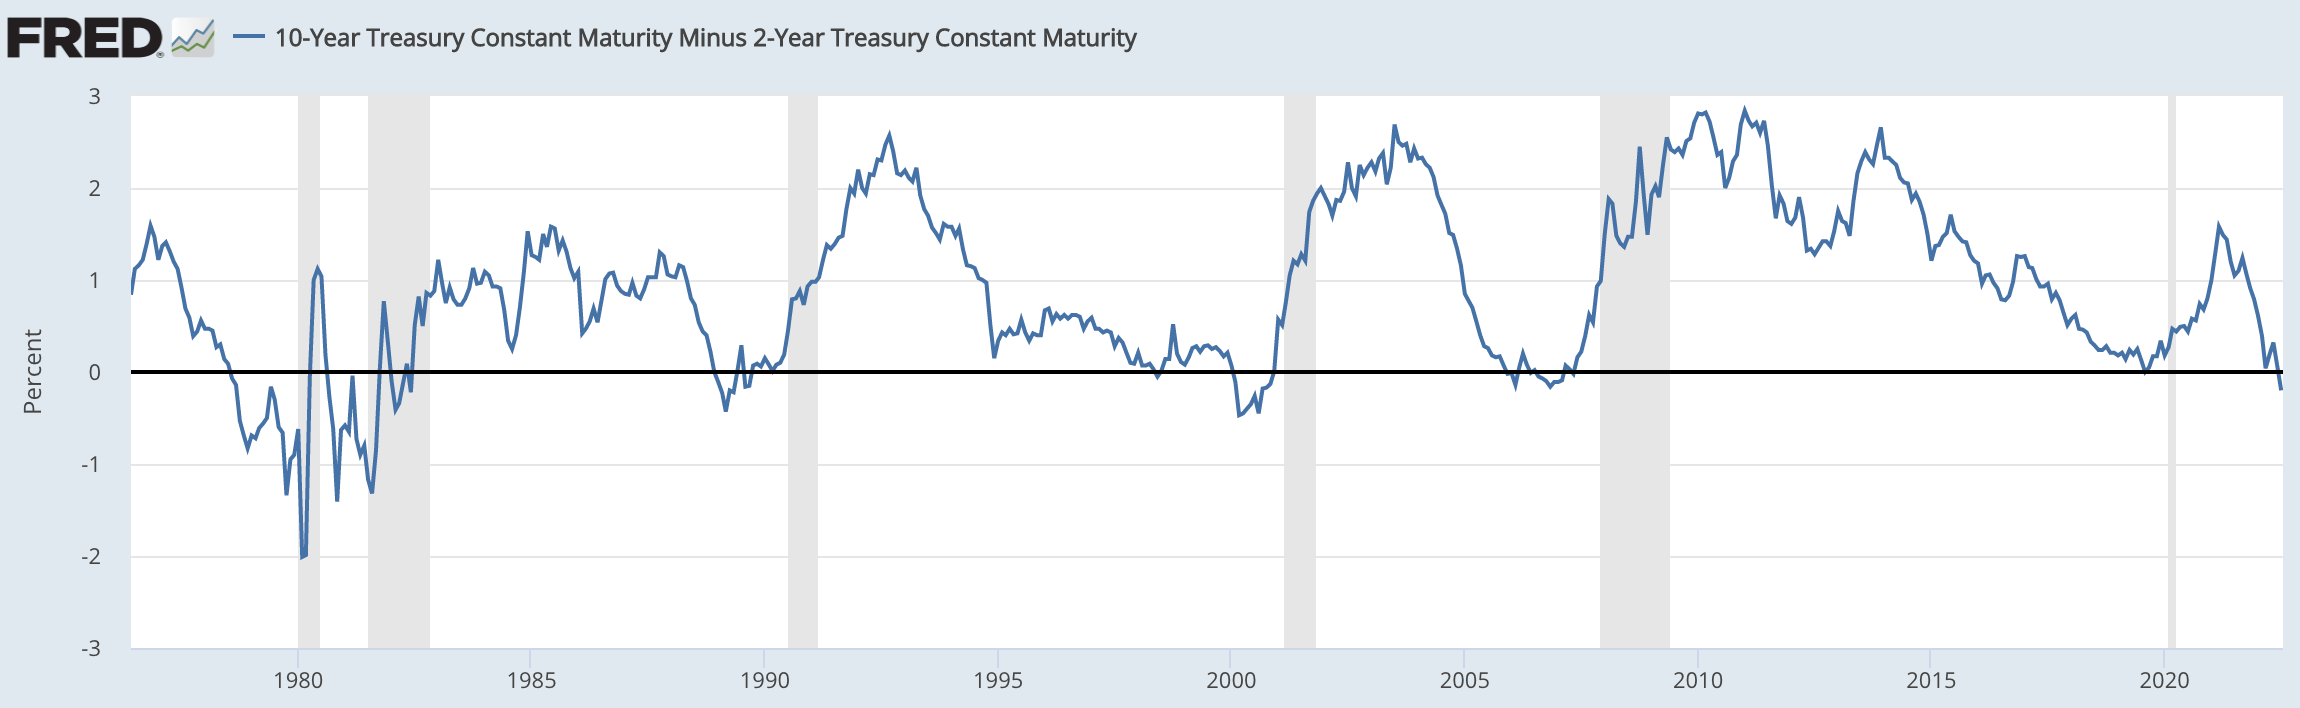
10 year and 2 year spread keeps declining
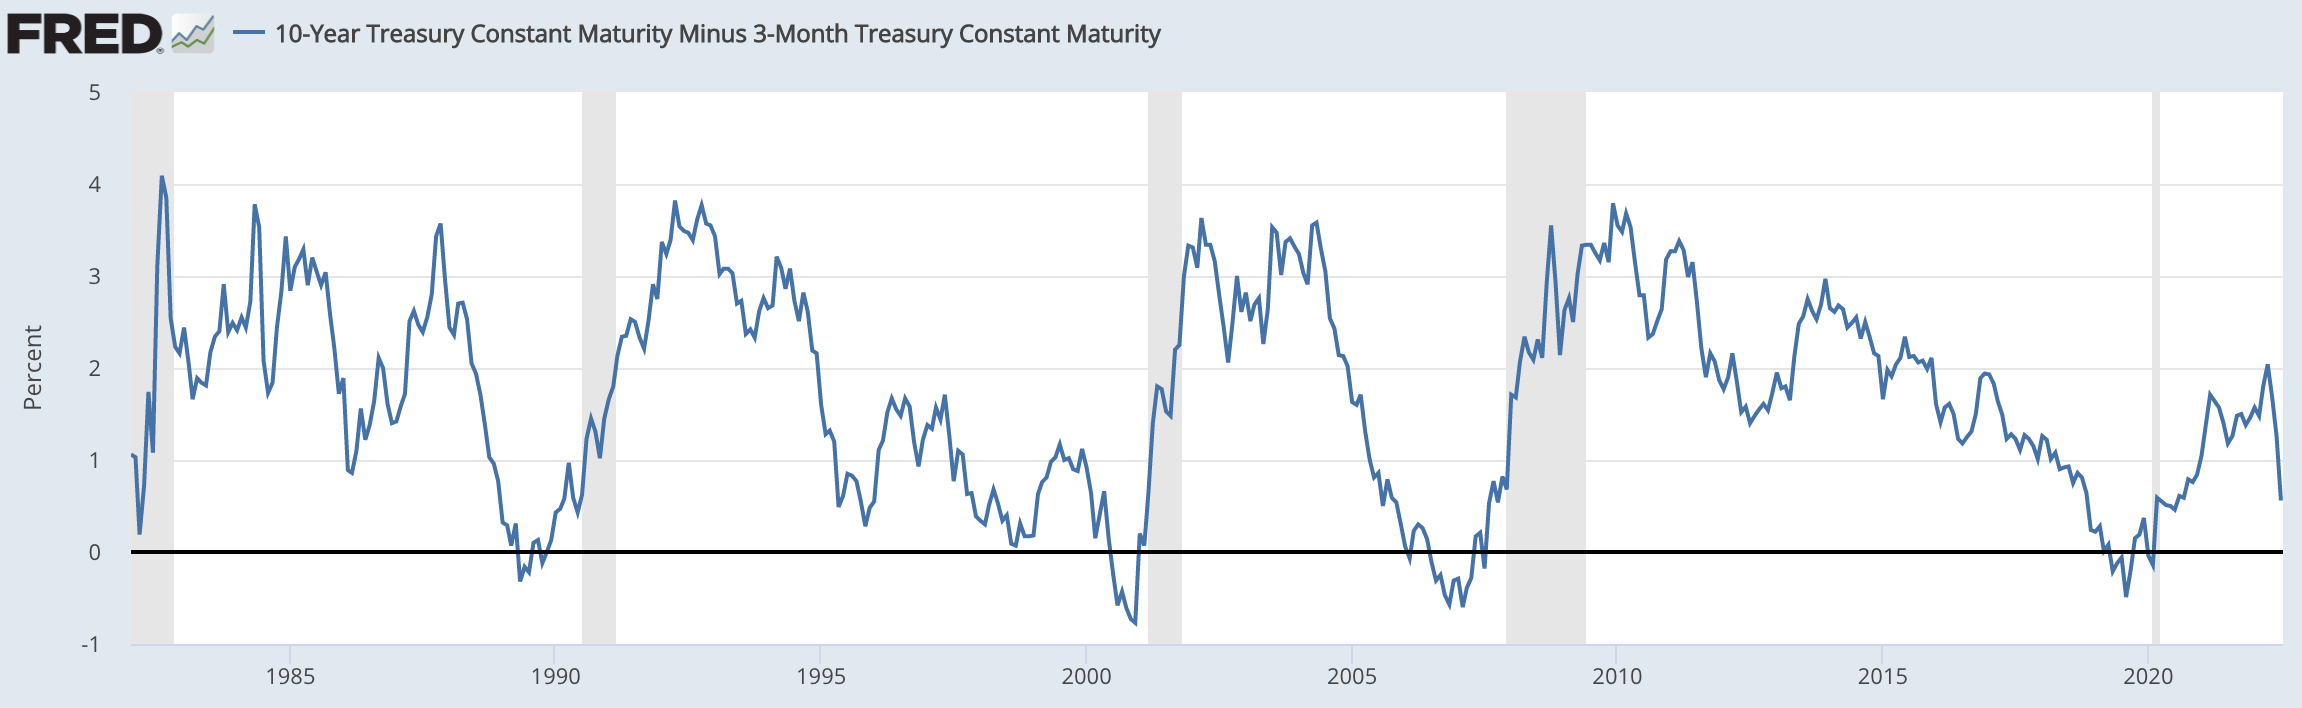
10 year and 3 month spread is flattening, quickly
Professional money managers know and understand the yield curve and how inversion proceeds a recession every single time. The thinking is that the Federal Reserve has been behind every major boom and bust in the economy since its inception in 1913. When the shorter end of the yield curve (3 months or 2 years) has a higher yield than the 10 year yield, it signals a recession because both short term risks exceed long term structural risks and that the Federal Reserve will likely hike above “neutral”.
The longer end of treasury bills assess a different type of risk, obviously, because it’s longer in duration. The 10 year, 20 year and 30 year assess more structural, longer term, trends in the economy. It prices in things like demographics, productivity, and long term structural policy. It address more of the “secular” forces rather than the cyclical.
The shorter end of the yield curve is significantly more focused on the Federal Reserve and what the expected Federal Funds rate will be in the short term. For example, the 3 month yield: If the Federal Funds rate is 1.5% today but you know they are going to aggressively hike in the near future to combat inflation, which will push it up to 2.5% - 3%, you would rather buy the 3 month at a higher yield, right? This line of thinking drives the treasury yields on the short term.
What I am trying to say is that the Bond Market is sending a clear signal that the near term risks vastly out weigh the longer term risks. Professional money managers are aware of this and have been positioning their portfolios accordingly.
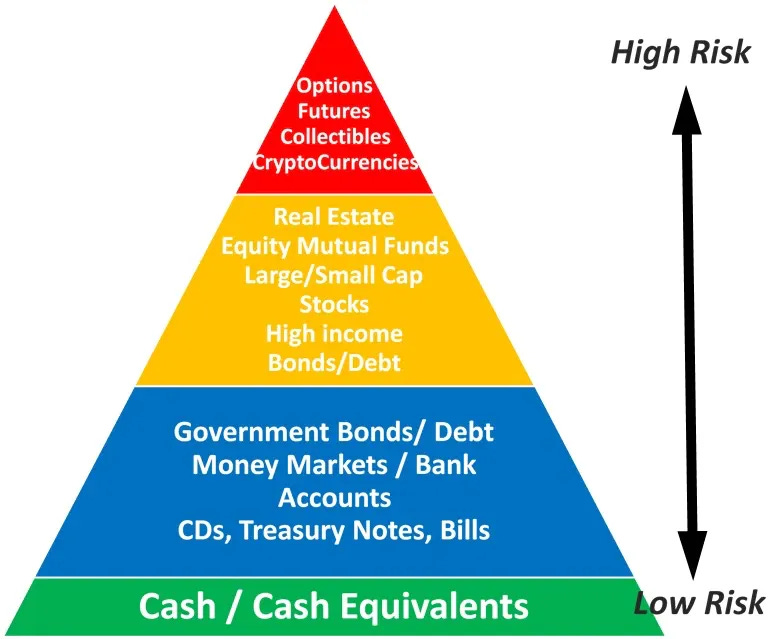
2.) Large Caps and the “Least Risky” have the Most Risk
There is realistically a scenario where an “earnings recession” is feasible for those holding ETF’s or mega cap stocks. However, other areas of the market just don’t have froth anymore. Currently, the forward P/E in large caps is roughly 15/16x, which is historically on par with the “average” but analysts are still pricing in 9% earnings growth on the S&P 500. I wouldn’t be surprised to see this come down a little bit more to the 13/14 range.
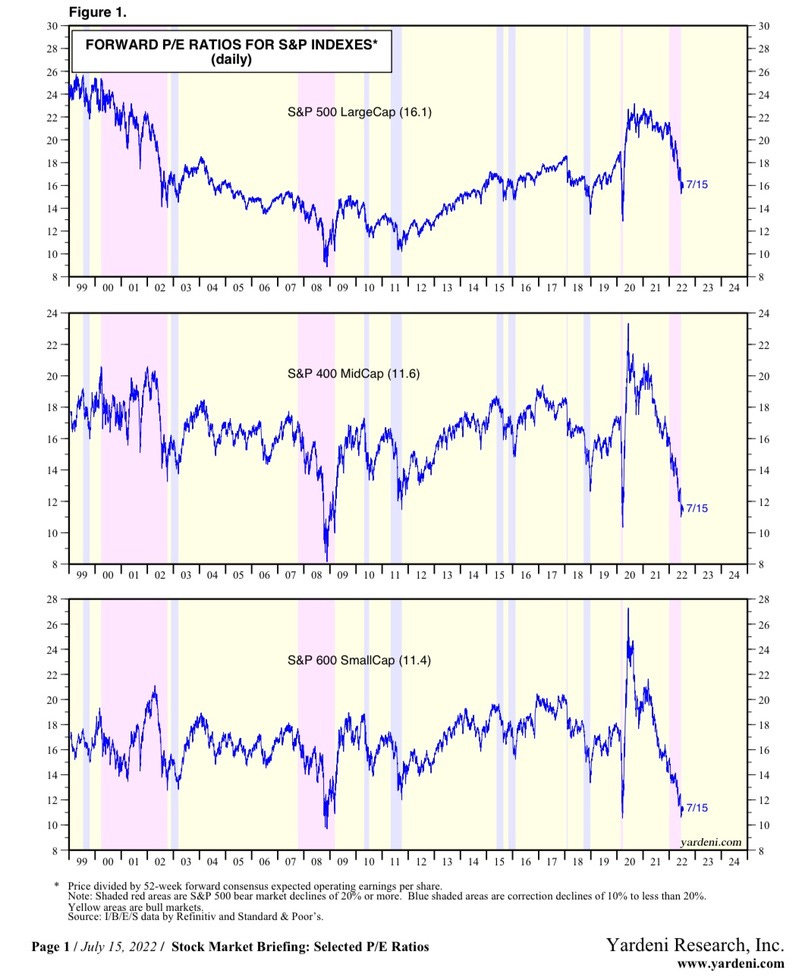
However, it’s extremely note worthy to see the small and mid caps trading approximately in a similar area as the lockdowns in the COVID-19 pandemic and 2008 global financial crisis. Originally I anticipated the small and mid caps to be trading down because of inflation but it does appear that they are priced for a recession. Equally of interest is least cyclical parts of the economy have also, appeared to have, priced in a recession.


Secular stocks are not impervious to recessions but they operate differently than, let’s say, consumer facing businesses like real estate or vehicle companies. These businesses are typically going to be B2B rather than directly exposed to the consumer, who suffers the most during economic recessions. However, businesses are not going to reprioritize mission critical business processes like cyber security or cloud infrastructure. Many of the businesses listed above are deeply engrained into the business process and enhance the overall efficiency of the organization. In addition, many of them are deflationary in nature and also solve short term problems like the labor shortage.
I am confidently under the impression that many “riskier” stocks (or as deemed so by traders) are priced accordingly given the macro back drop. The story is different when it comes to larger businesses in the S&P 500 like Coca-Cola or Costco. These businesses are not valued as “value stocks”. They have been safety stocks for the better part of this market cycle, making them most at risk of a draw down in the short term. Much else appears to be priced in.

3.) Rate Hikes are already Priced in When it Comes to Equity Risk Premium
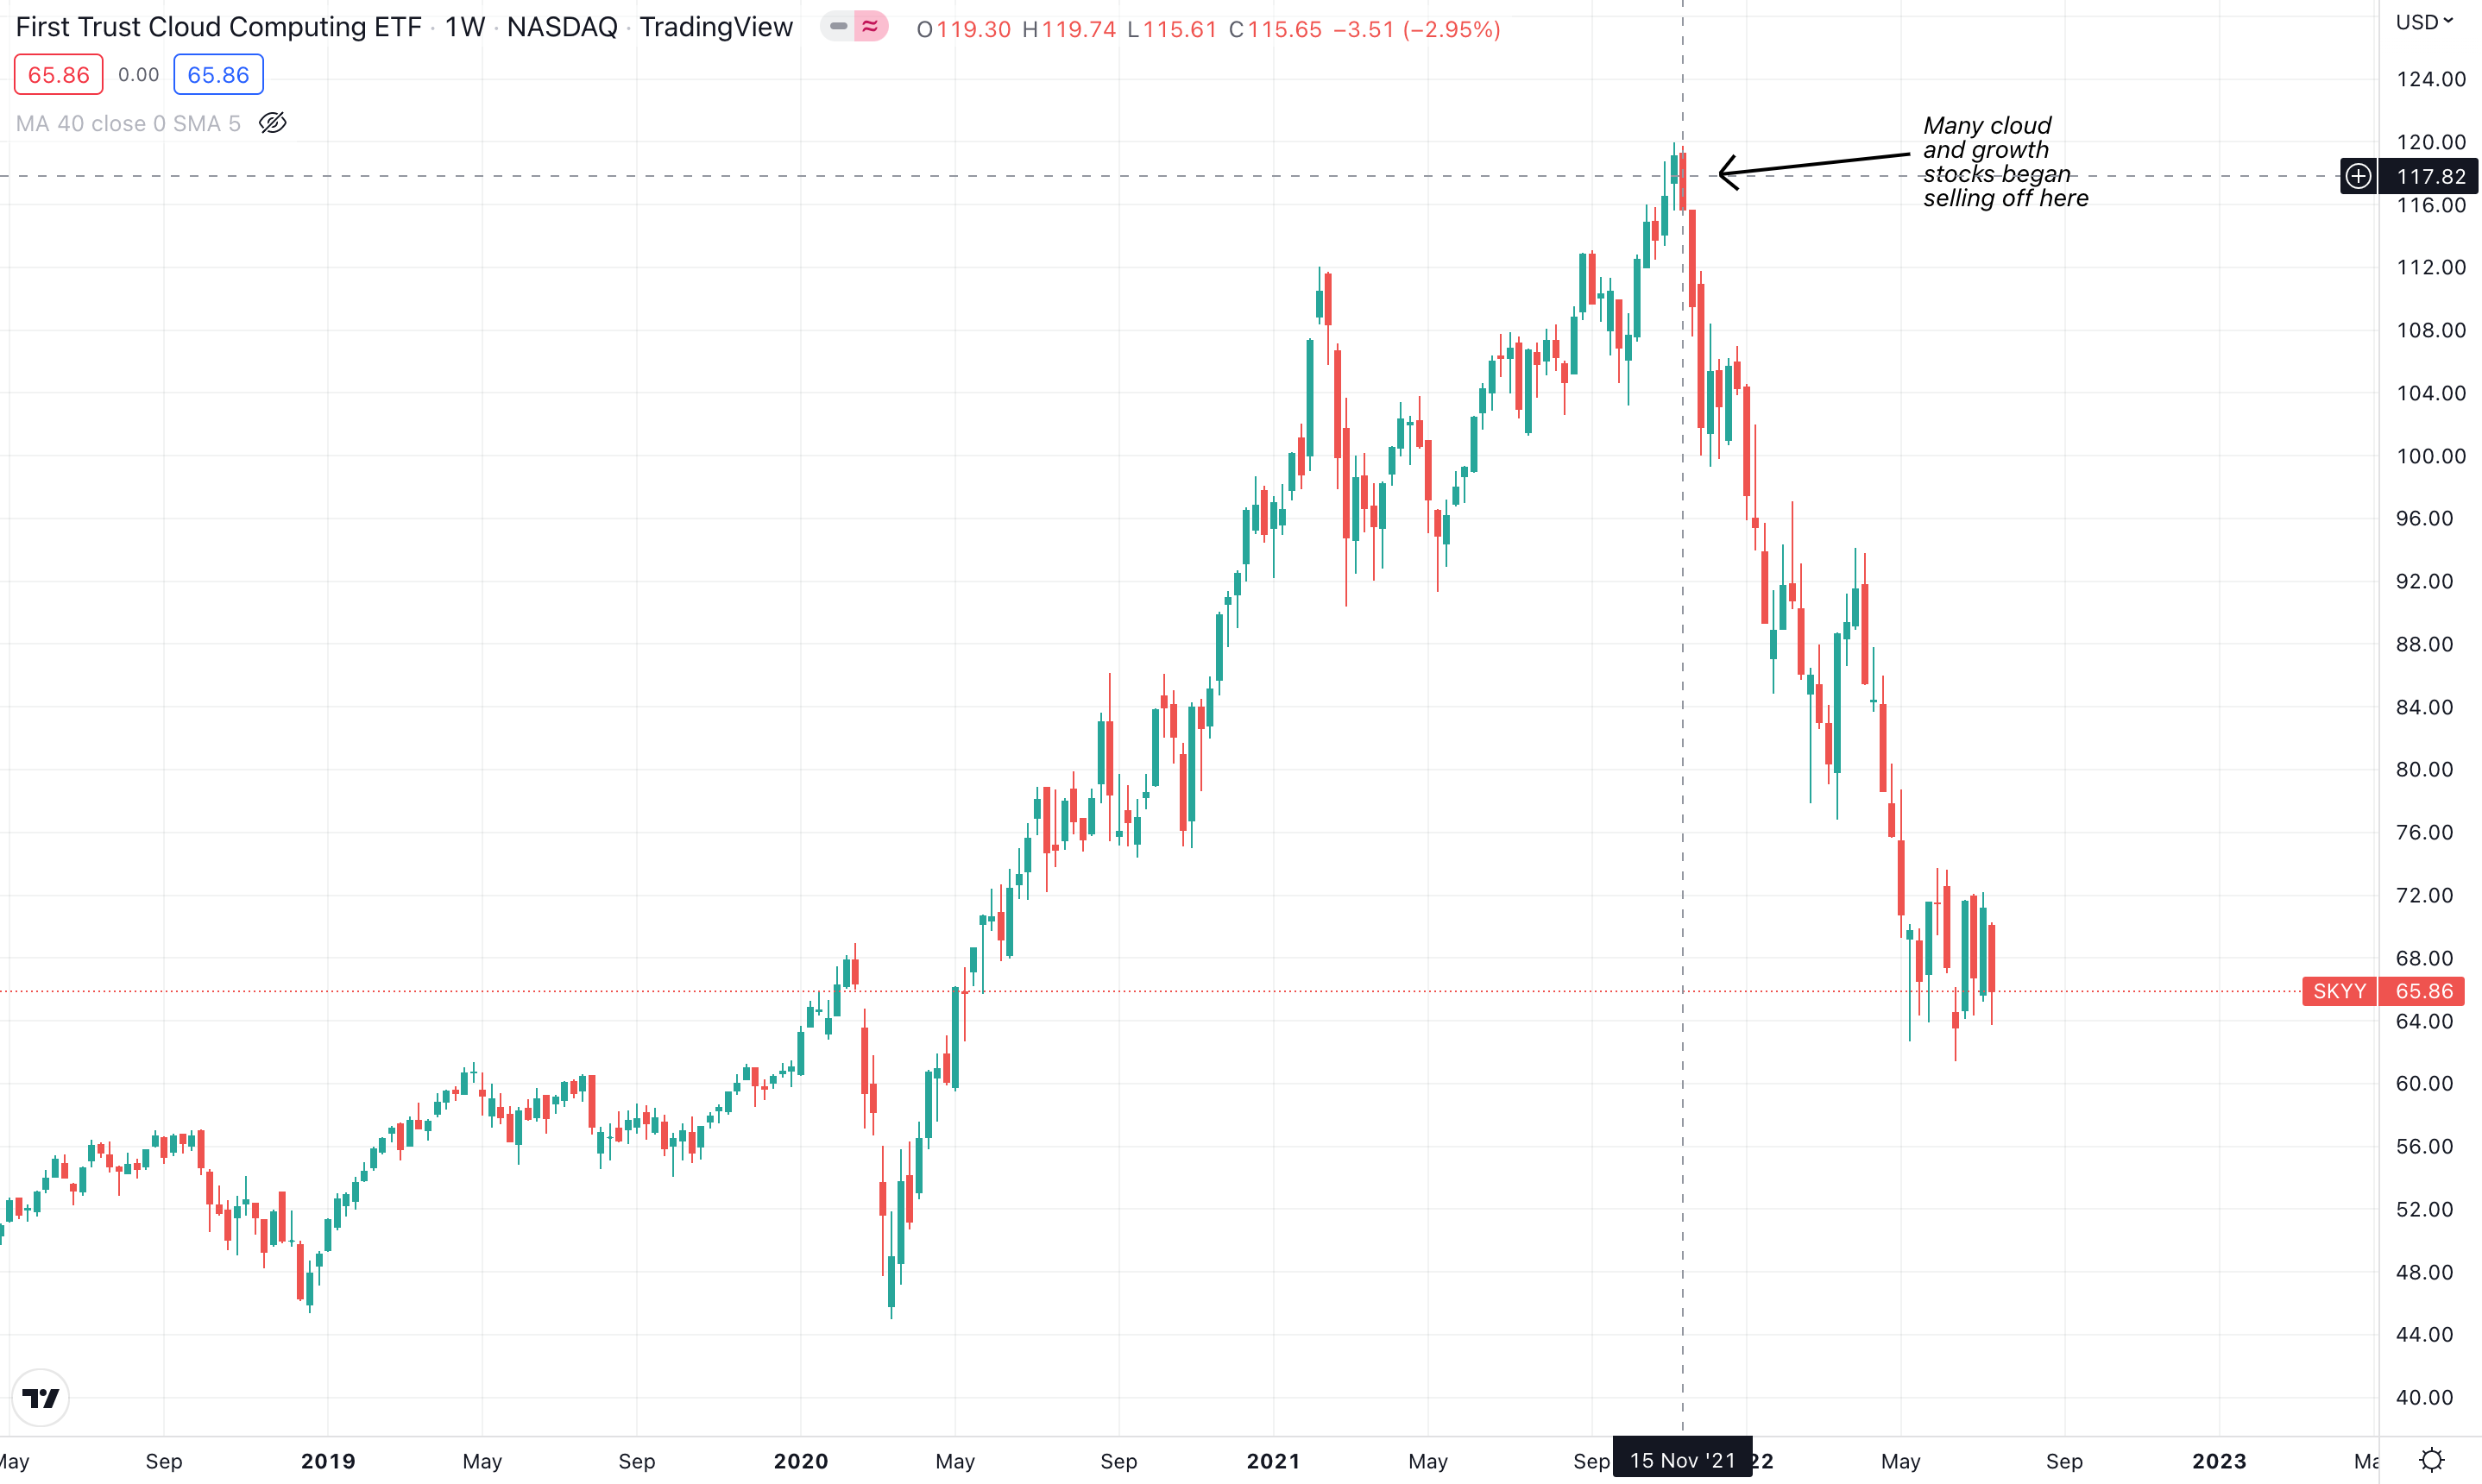
If we circle back to inflation, we have to remember exactly why stocks began crashing back in November. It was not inflation, inflation began roughly this time last year and many businesses continued to rally until November. It was the equity risk premium contracting. This means that as the 10 year yield and 2 year yield rose, riskier assets had to decrease in valuation.
As less risky assets become more attractive for investors, like treasury bills, they look at this as “risk free return”. The thought process is, “if I can get a 2 year treasury bill for 3% guaranteed return over 2 years, why would I put my money in a riskier asset like equities? I need a larger incentive (yield) to take that sort of risk.” If we look at the 2 year yield, it seems obvious in hindsight.
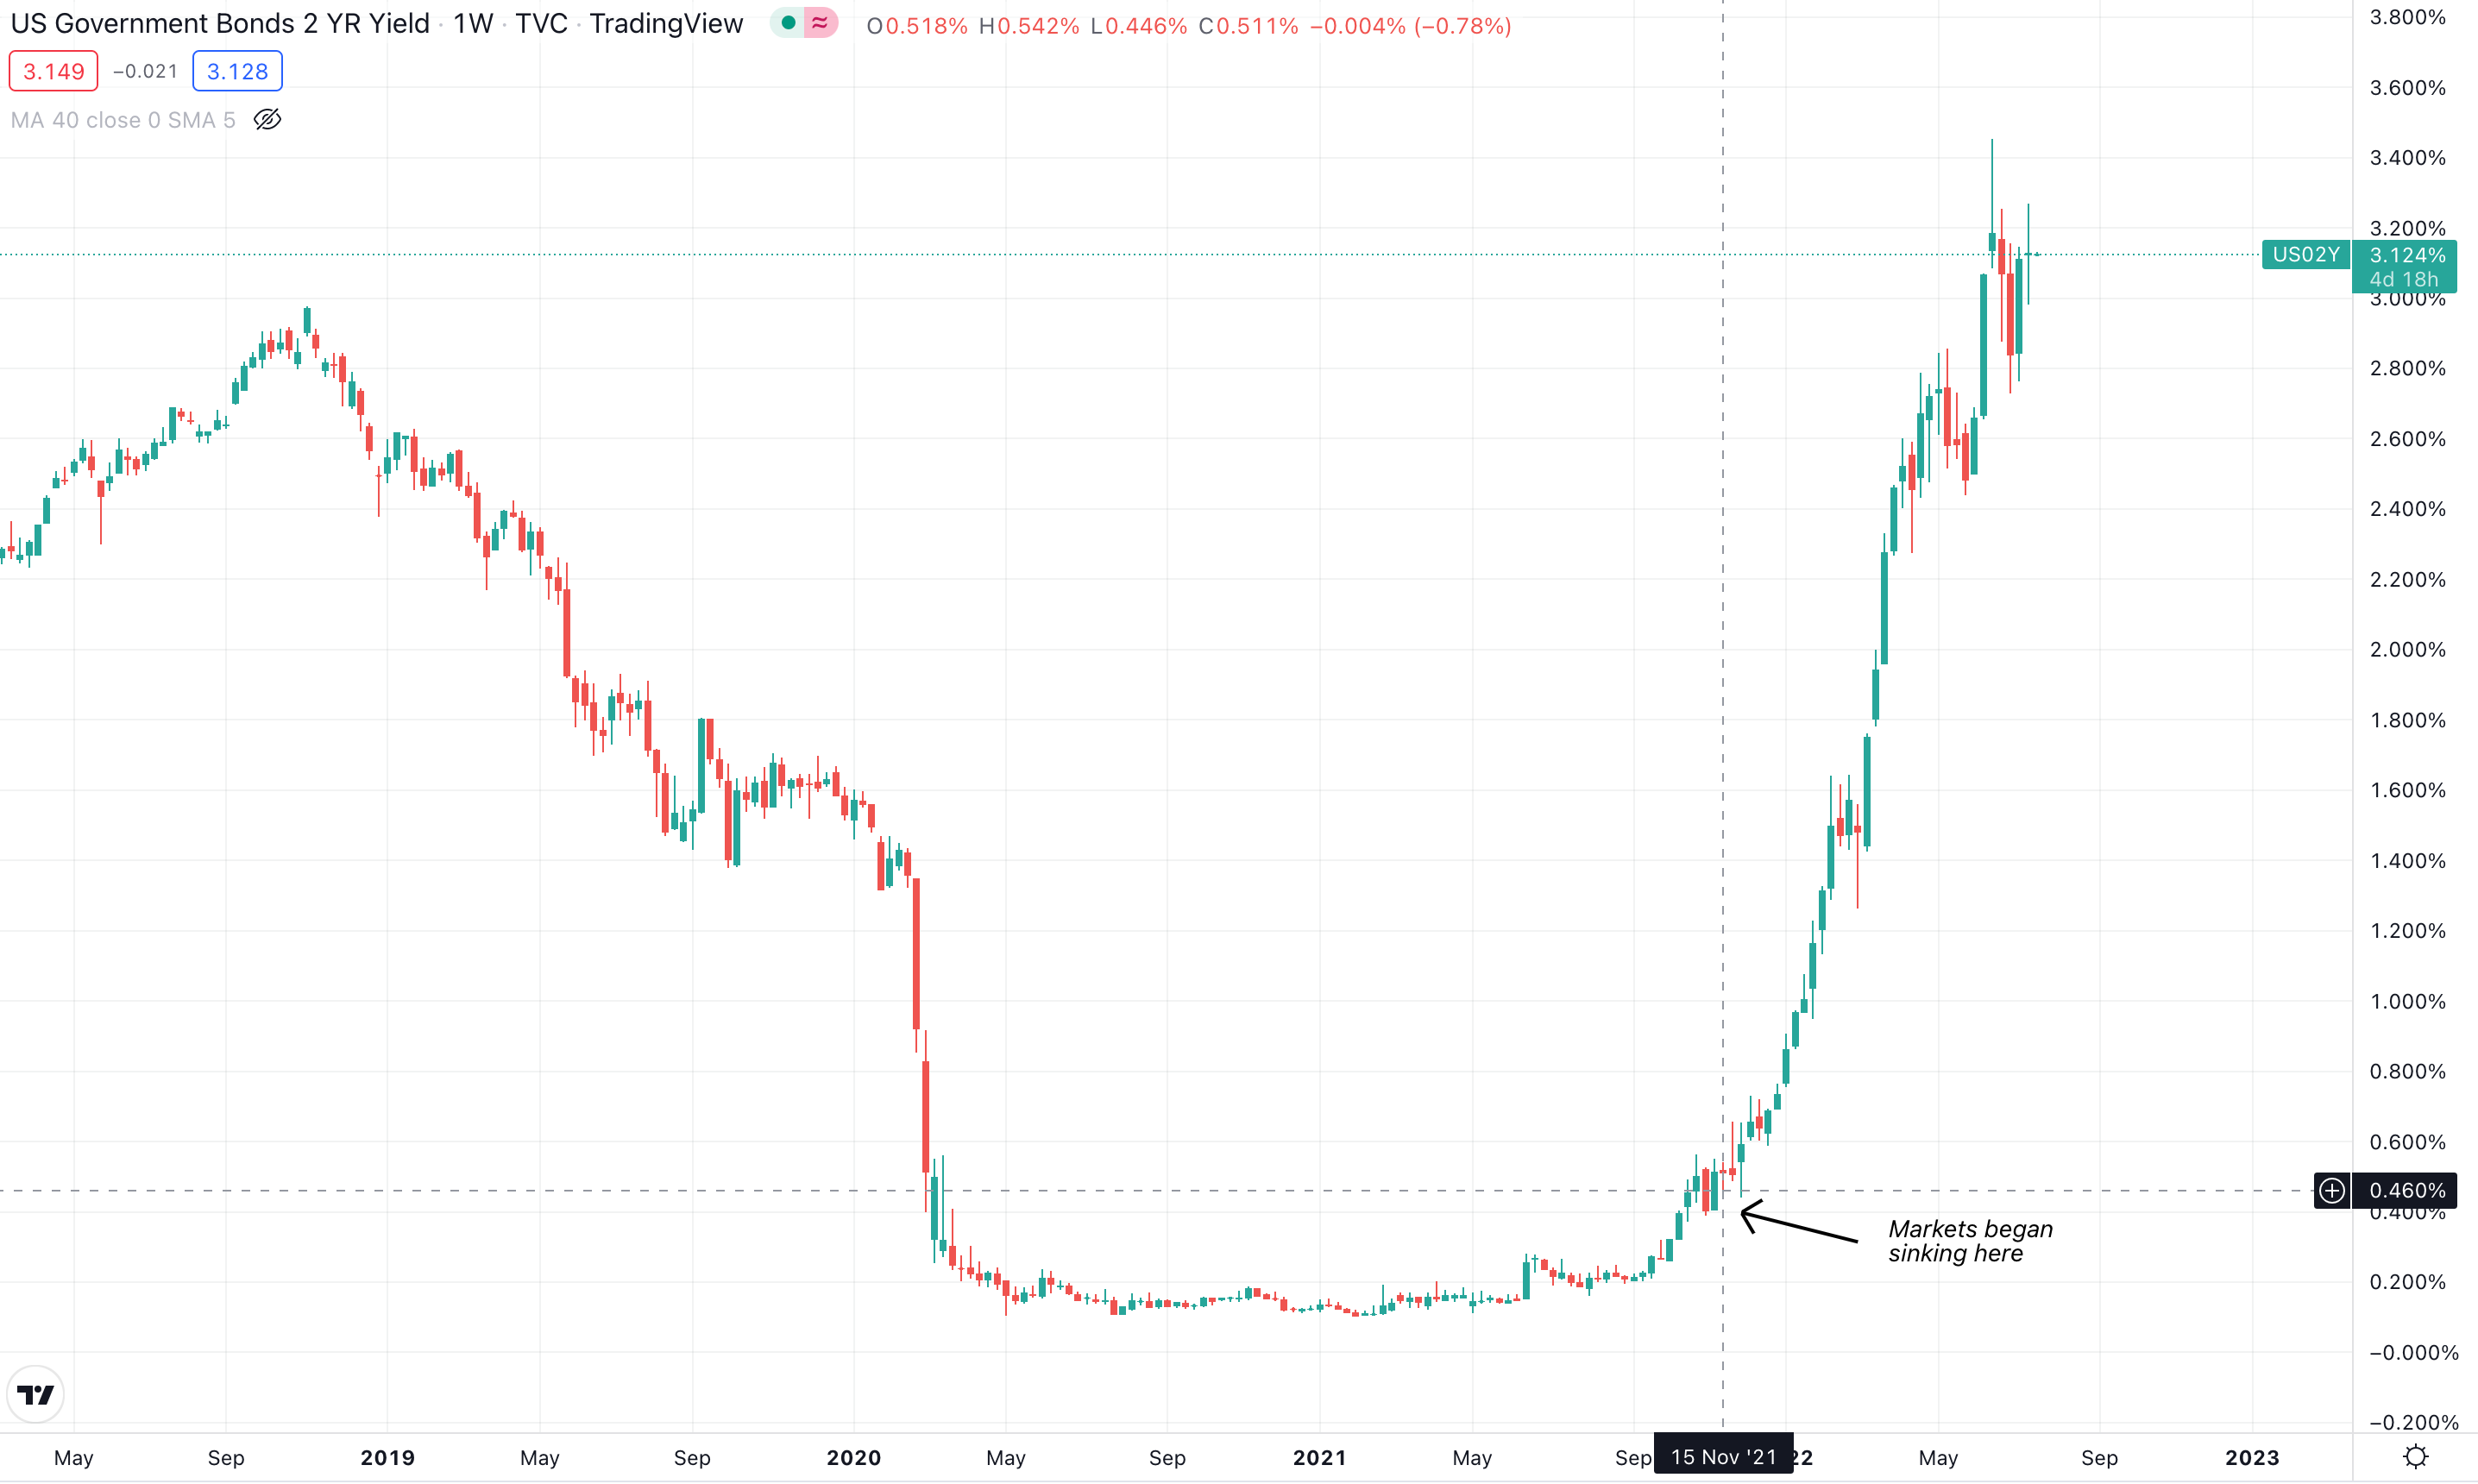
When we compare the 2 year yield chart to SKYY, a cloud computing ETF, the correlation is striking. Pay attention to November 15th, 2021 on the 2 year yield and November 15th, 2021 on the cloud computing ETF. They are directly correlated, almost to a T.
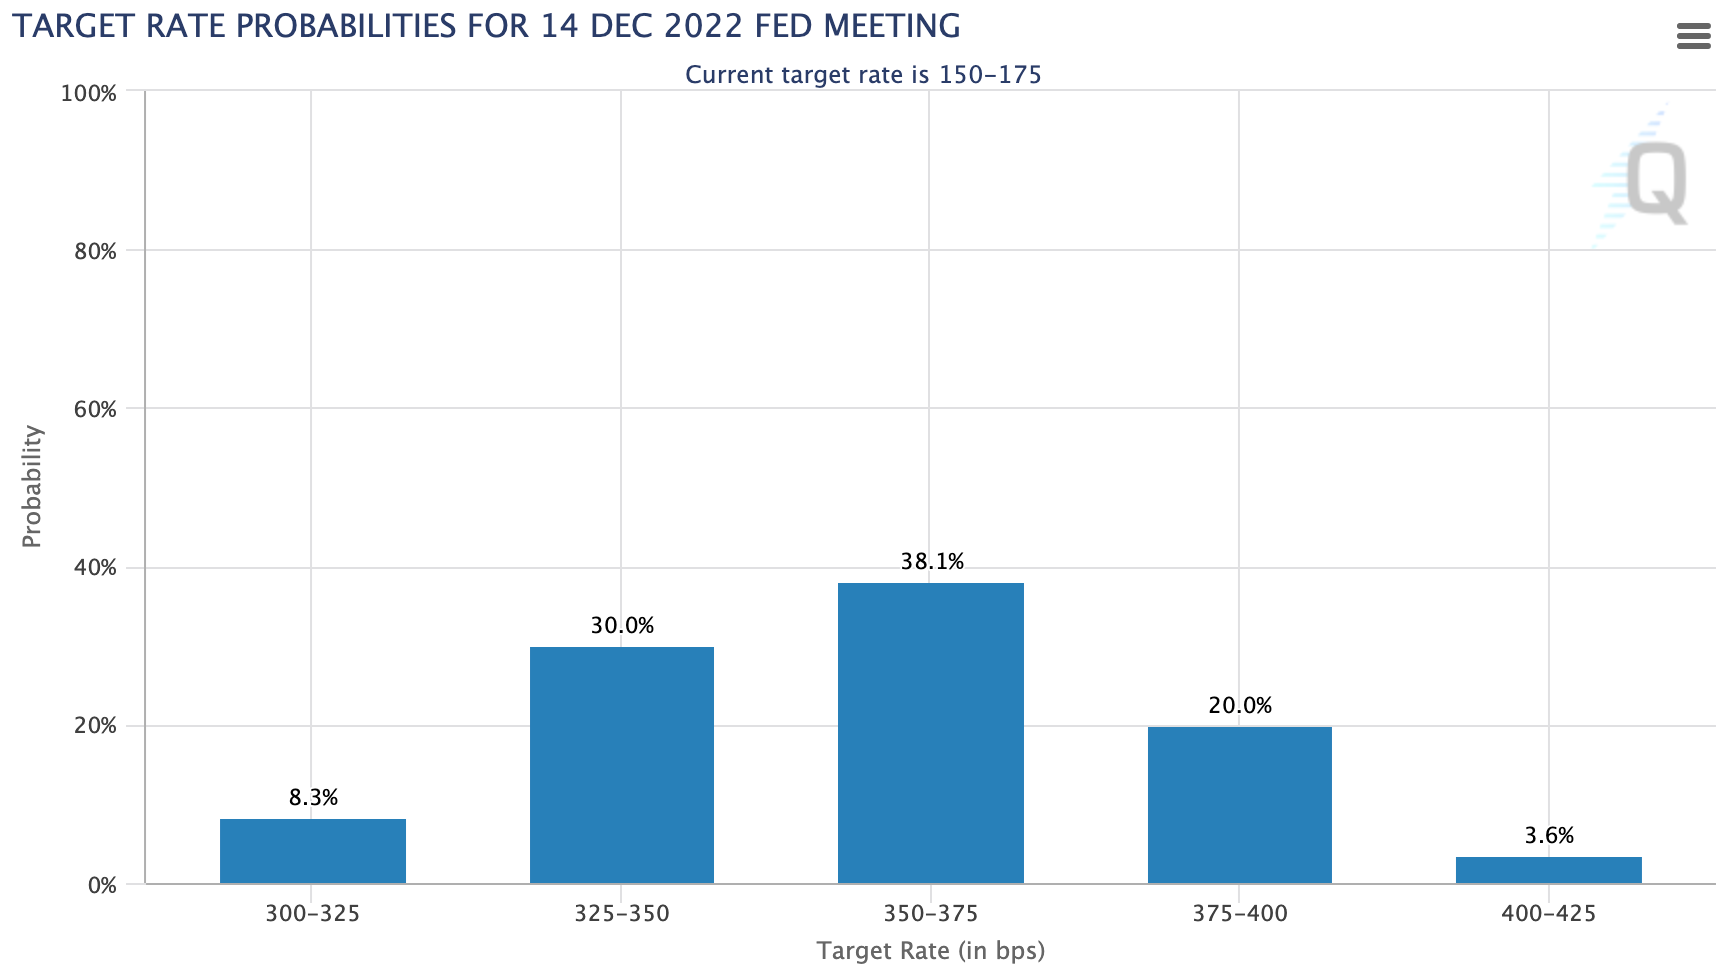
To further understand what is or is not priced in to the market, we have 2 tools we can watch. (1) The federal funds rate to 2 year yield correlation and (2) the Fed Watch tool, which gives us what the market is “pricing in”. Below, we can see that the 2 year yield historically leads the Federal Funds rate and what Federal Funds rate the market is currently priced at for the next 6 months:
2 year yield (red) and Federal Funds rate (blue) - it’s noteworthy that sometimes the 2 year yield over shoots the Federal Funds rate

The Bond Market has another 200 bps priced in from here - we are expecting .75 bps at the end of this month
If You Wondered Why Markets Didn’t Sell off After the Last CPI Data @ 9.1%
The equity markets didn’t sell off because rate hike expectations where unchanged despite high inflation. Even though recessionary fears are at a high, now probably likely, a decline in the index’s would make more sense but many stocks beneath the surface may have still found their “low” on May 12th. This belief is held due to compressed valuation multiples, continued expansion of the underlying business performance and the likelihood that interest rates will actually decline from here.
Earnings Implication and a Few I am Watching
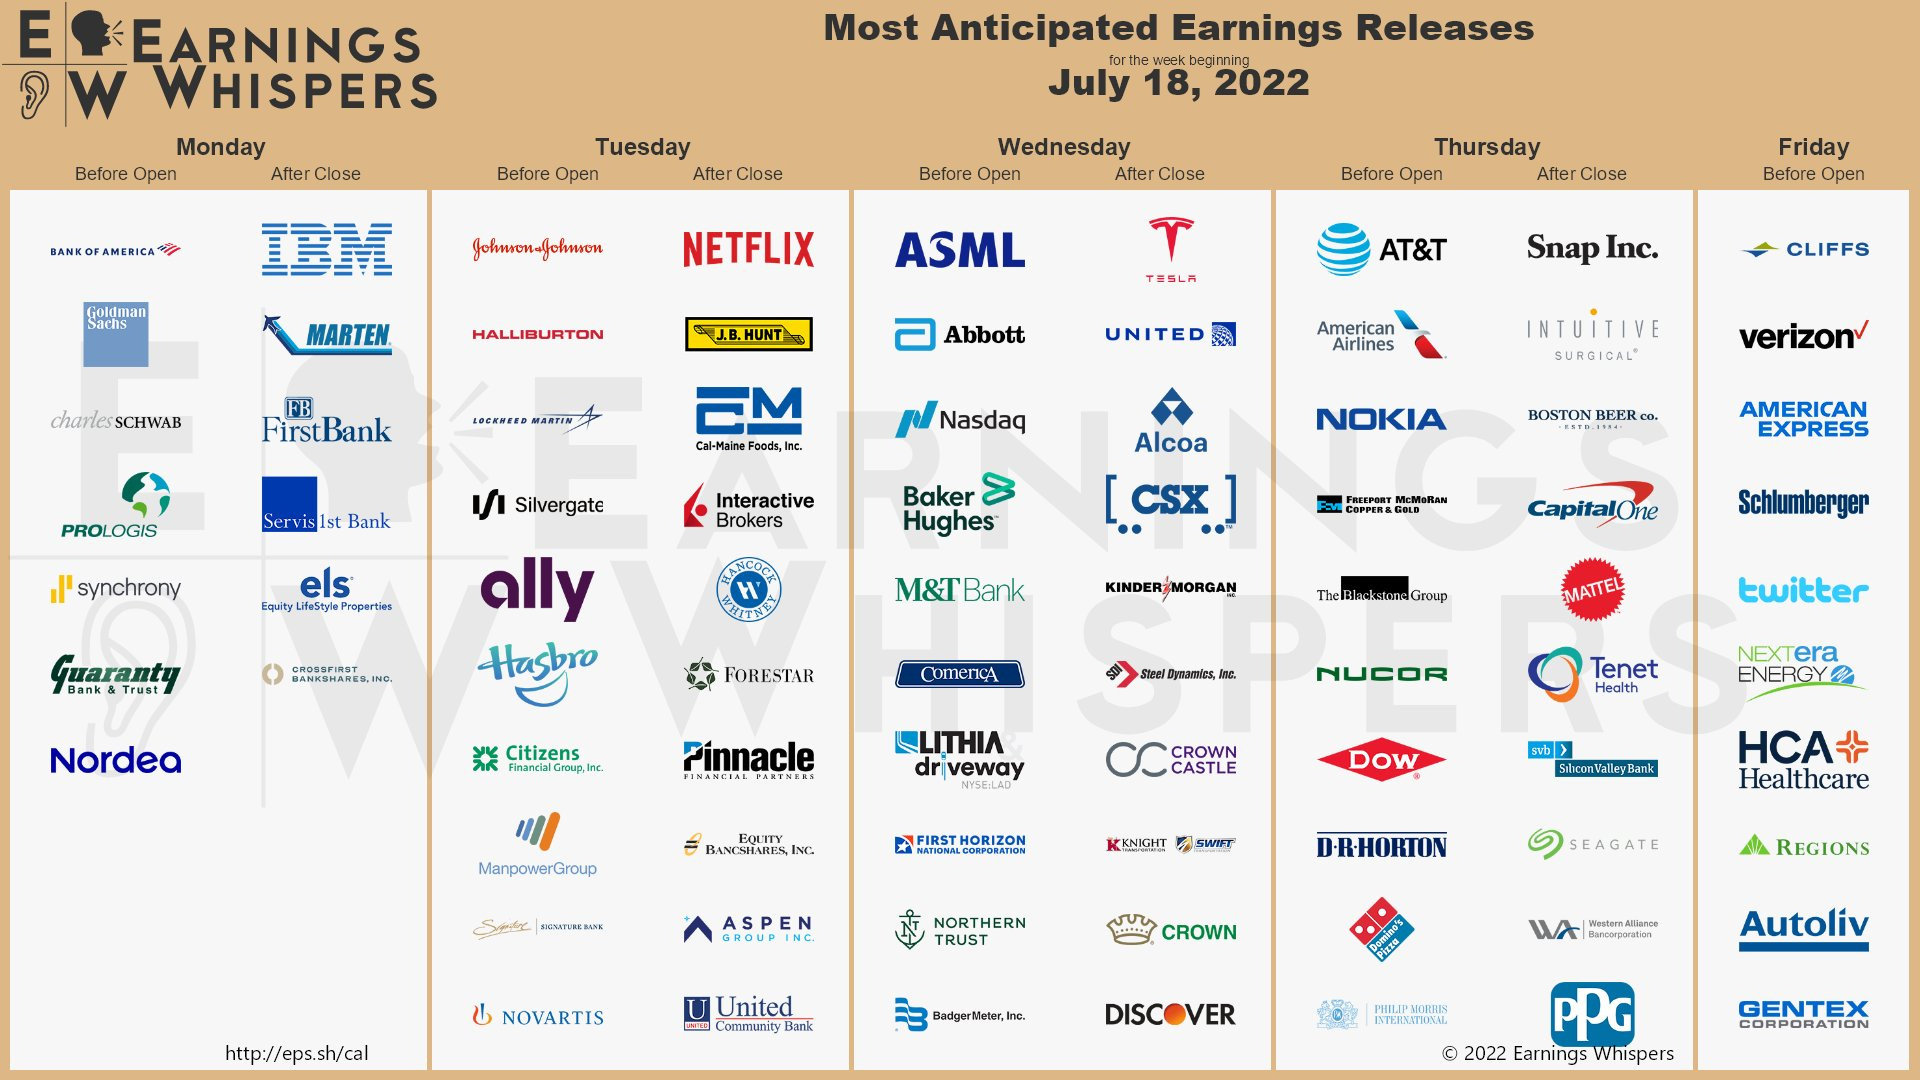
Pay attention to price action and the results of many businesses. As mentioned in the beginning of this News Letter, JP Morgan reported abysmal earnings and still finished flat on the week. If any of the businesses above (like Goldman Sachs) show less than impressive results and little movement in the stock price, this would be continued bullish momentum.
I am nervous for one business, Tesla, which is a company I own. I am not so much worried about business execution as I am worried about the Chinese lock-downs that have transpired over the past few months. This has slowed down deliveries and sales. My worry is less about the business and more about what Wall Street expects currently of Tesla’s earnings. Considering Tesla’s forward P/E is roughly 40, it may see minimal valuation contraction depending on bottom line performance.
My focus on this earnings season is less about beating analyst expectations. I expect businesses to miss expectations. I am more focused on the price action following earnings misses. The price action will tell us more about where we are in the market cycle and if the “bad news” has been priced in already.
My Portfolio Update
Keep reading with a 7-day free trial
Subscribe to BluSuit to keep reading this post and get 7 days of free access to the full post archives.