
Portfolio Update: The Shifting Market Cycle and Deflationary Fears
Portfolio Update: The Shifting Market Cycle and Deflationary Fears
We are leaving one regime and entering into the next

There is a lot going on in the markets and this week, we finally witnessed the regime change I was anticipating for some time. I am very excited to share what we are seeing and what it means for inflation, recession, and equity performance.
I have recently received requests to view what I post on a weekly basis from many subscribers. Because of this, I wanted to provide a portion of this weeks Newsletter complimentary. If you like this kind of research, consider joining our community. It also comes with a Discord room as well.

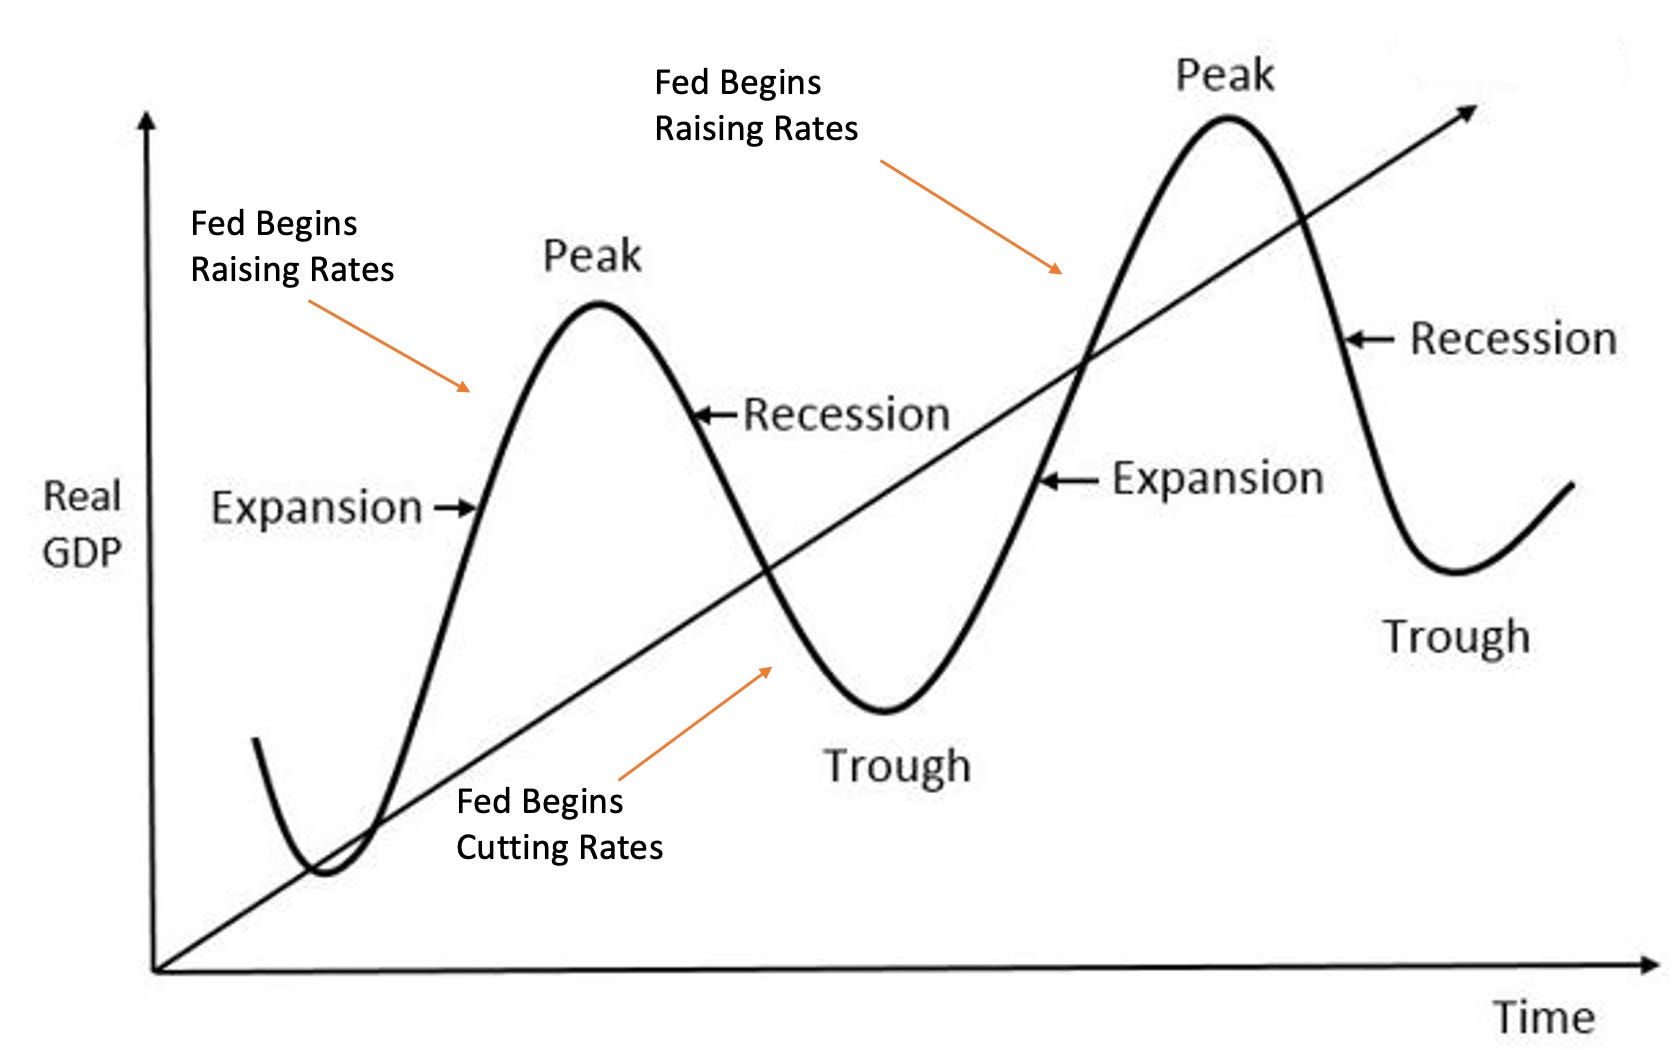
In this publication I am going to talk about the cyclical shifts in the market and the sectors that are likely to perform for the next few months. We are going to factor in:
Earnings recession, meaning businesses will guide down
The shift in the bond market and what it means for equities
A new stock I bought and a position I sold
An update to my portfolio’s recent out-performance
It is Finally Here and the Fed Acknowledged it, a Recession

Here’s the thing about this recession, the S&P is already in a bear market and the NASDAQ is already down 30%+. A lot of damage has already been done to the markets and much of the recession has already been priced in. Regardless, we need to talk about how markets behave during periods like this because it is not consistent with what the mainstream narrative is claiming. In my opinion, the narrative is lagging about where we are going. Below, I wrote about a coming recession in January of 2022.
I share that not because I am trying to “toot my own horn” but to share with every one that typically the news flow has already been priced in by the time CNBC, or even the Fed, notices it. Today, we are beginning to see the next phase of the business cycle being priced into the market. That means that yesterdays leaders will likely begin to lag and the losers are destined to begin leading once again.
The Market Cycle Indicators
Usually I look to the bond market to understand and identify where we are at in the market cycle. The reason why I do this; the bond market is so massive and important to the economy that it controls the short and long term economic cycle(s) that we are in.
The correlation between the long and short end of the bond market typically is a leading indicator I observe the most. The longer end (30, 20, and 10 year bonds) tells us what the long term “structural” trends are such as demographics, population growth, and secular deflationary/inflationary forces. Shorter term bonds are typically reflective of the Federal Reserve policy within a 3 month to 2 year period.

This is where it gets really interesting, to me. The above chart saw a decline in the 2 year yield from the last FOMC meeting. The significance lies within the timing of the yield rather than the short term price action alone. If we recall, at the last FOMC meeting they (the Fed) raised rates .75 bps which was the largest raise for the past 2-3 decades. As a result, yields spiked and the market anticipated more rate hikes this year. But, since then, yields have actually fallen. The falling yield is NOT something that happens if the bond market (smart money) expects inflation to persist.
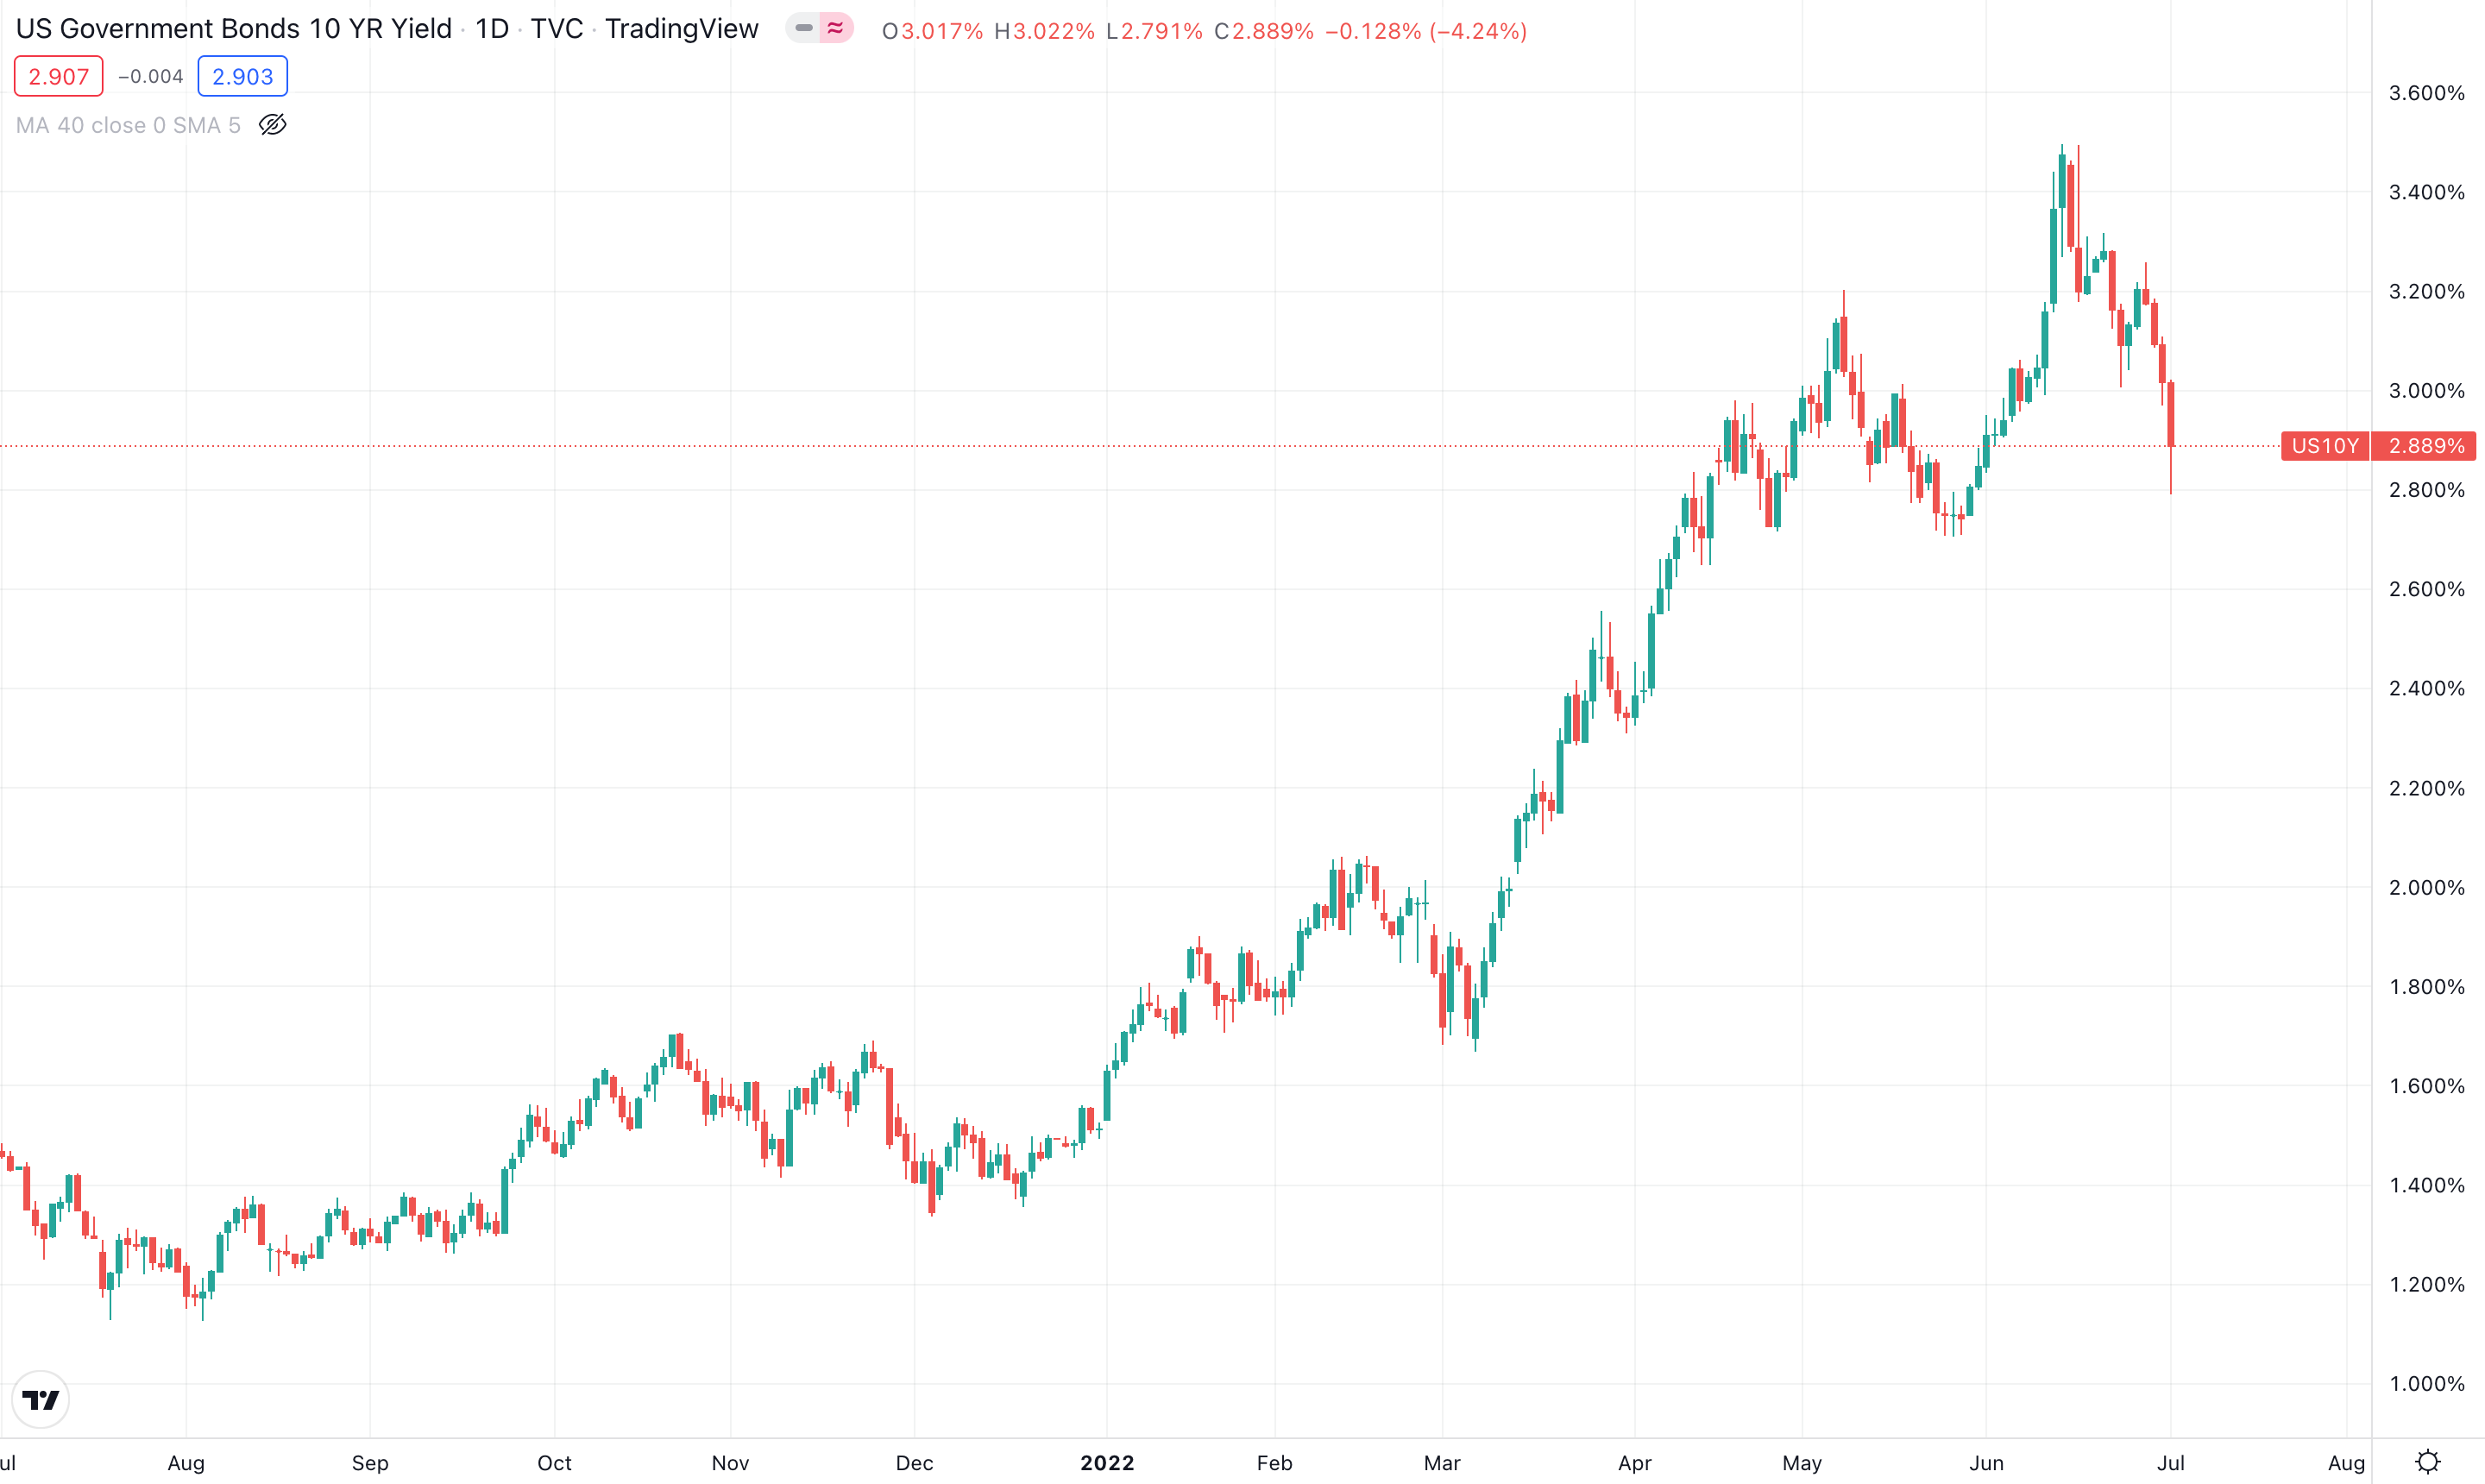
The 10 year shows us similar price action as we are now below where we were pre FOMC meeting. So, how can we read this and what is this telling us?
The bond market is not expecting the Federal Reserve to hike rates much further and a further decline would indicate much bigger risks
Recession fears are taking priority over inflation fears, meaning what the Federal Reserve is doing is working to “combat” inflation
The market has hit max hawkishness and is beginning to look toward rate cuts!


I need to emphasize that the market is looking forward to rate cuts, not rate hikes, because of recession and deflationary fears.
This is best reflected in the Fed watch tool, as you begin to see the market pricing in less rate hikes over the past week. Below was the expected Fed Funds rate last week. Pay specific attention to the long end, the 350 - 375 and 375 - 400.

Below was what the market priced in this week, pay attention to the long end.
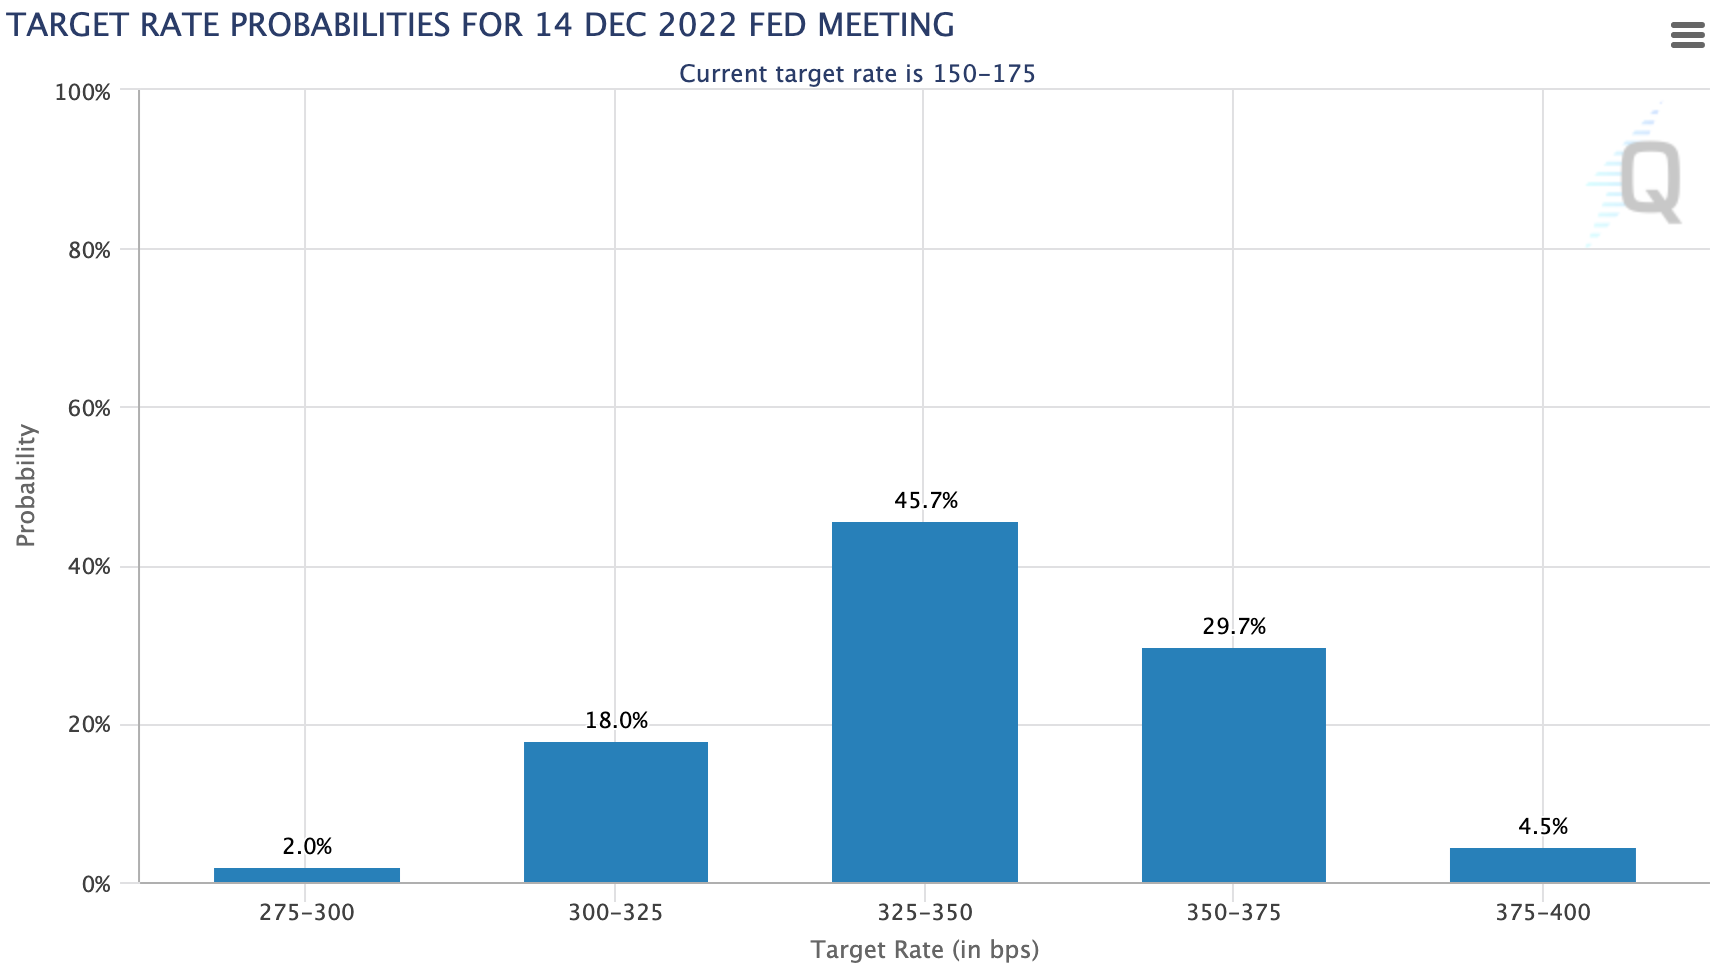
The importance of this event was detailed in last weeks SubStack where I mentioned that I believe markets will anticipate the Fed’s move rather than pivot on the exact day of the Fed meeting.
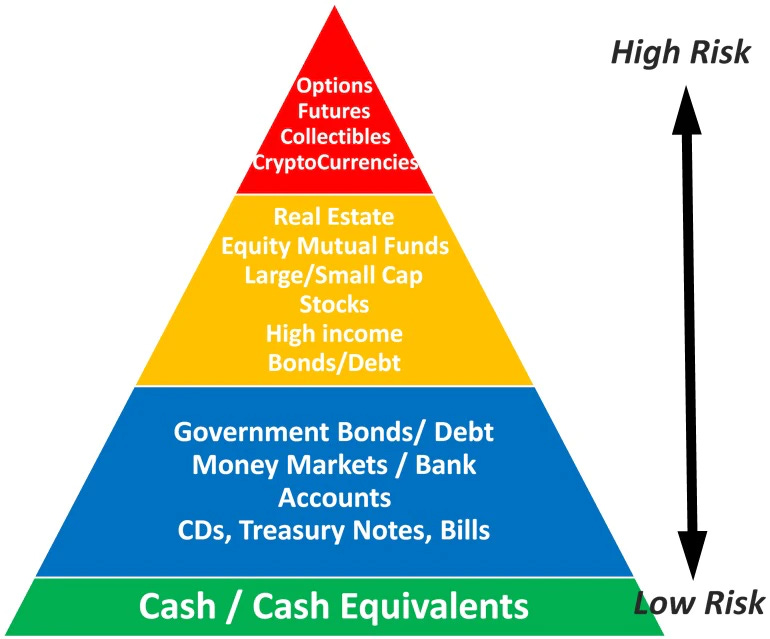
For the better part of this year, much of the bearish price action was driven by the moves made in the bond market. Essentially, we saw a valuation re-rating because yields were rising and due to the equity risk premium associated with the financial markets. The equity risk premium acts a lot like a pyramid. The more liquidity, the higher up the pyramid we go. The less liquidity, the lower down the pyramid we go. This correlation with liquidity and risk premium is also relevant toward investor sentiment. During periods of shakey economic data, investors take less risk, thus going down the pyramid below.
If inflation expectations continue to go down and lower rates begin being priced in, equity multiples will expand.
This is particularly important if the theory of max-hawk outlook is true, which I am certainly under this belief. However, we need to address the elephant in the room and that is recession. At the moment, there is a lot of recession fears out there and we are likely in one right now. There are two points that I want to make in regards to a recession and price action in the markets:
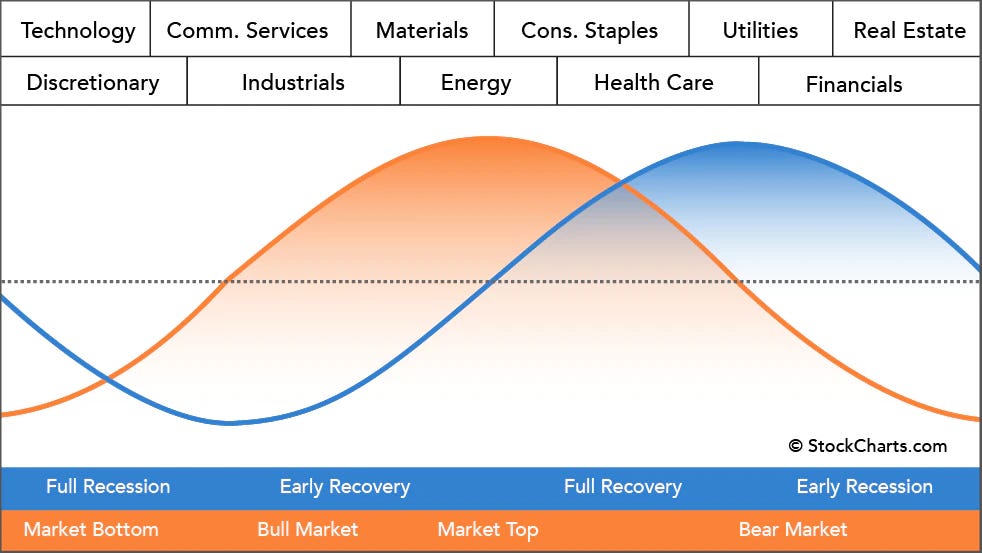
Markets bottom in the middle of recessions, especially technology and growth stocks. Investors typically seek growth during these periods because more cyclically prone businesses like Real Estate, Energy, and Consumer facing products are experiencing a fluctuation and decline in their sales. This impacts earnings and expectations.
The Federal Reserve is the horse and the economy is the buggy. Even if earnings miss during a period where the Fed is becoming more accommodative, this doesn’t necessarily mean that the stock will decline on missed earnings. The best example I have is to compare stock price action to last November despite rockstar earnings. Stocks would bomb 20%+ in one day after earnings despite excellent results/guidance. This is a result of wall street creating their own forecasts based on economic growth and sector rotation/impact and how accommodative/restrictive policy works with economic activity. Easing monetary policy will put in a bottom in stocks.


Growth Stocks and My Portfolio
It’s becoming clear more and more every day that growth stocks are likely to have put in a bottom. If you recall on Friday, growth stocks rallied while index’s declined for the better part of the day. This is most relevant to ARKK, where the algo’s seem to correlate Ark’s flagship ETF with every other growth stock on the market. Basically, it is representative of an entire sector, the innovation sector. This is typically where I find “my type” of stocks. If you missed this tweet, I provide further detail and how I use it to gauge where my portfolio will go in the short term and how I use it as a hedge:


New Portfolio Add and the Quick Adjustment I made
Keep reading with a 7-day free trial
Subscribe to BluSuit to keep reading this post and get 7 days of free access to the full post archives.