
Quick Market Update For the Week Ahead
Quick Market Update For the Week Ahead
I Expect Further Downside

I hope you all had a good weekend. I wanted to put together a quick Sunday morning read for all of you. Let’s take a look at a few charts and what we are seeing from a trend perspective in the markets.
I Do Expect Further Downside this Week
We have a few catalysts that will move markets:
CPI is going to release this week on Tuesday, April 12th. I expect this to come in hot as it will have the post-invasion bump in energy and commodity prices. On a positive note, we will see a decline in vehicle prices. I expect April to continue this trajectory. In addition, I do believe there are many leading indicators suggesting that inflation is peaking right now. This is bullish as it means the Fed can ease up a bit. We will know more as this month goes on.
U.S. retail sales data. This is important because it will give us information on how the consumer is spending. The biggest question here, will there be weakness? This may indicate an economic slow down, which will impact corporate earnings.
Both data points will give clues as to what the economy is doing, or trending toward. Remember, the 10 year yield and the 2 year yield recently inverted, paying attention to when/if a recession is coming is important.
As a long term investor, I pay attention to this data more from a personal financial perspective. This helps me answer questions like:
Do I raise capital in my portfolio?
Do I focus on paying down more debt?
How much stock should I buy this week/month?

The Momentum in the Markets Points Downward
When looking at the NASDAQ, the momentum overall is pretty weak but there are a few key levels to pay attention to this week. What I have noticed is that markets do respect their moving average (more than stocks do), which is interesting. I believe this may be algo driven, or a type of self fulfilling prophecy as everyone looks at these technical indicators. What ever it is, it does help pain the picture in the near future.
The 150 Week Moving Average Will Likely Signal Bottom
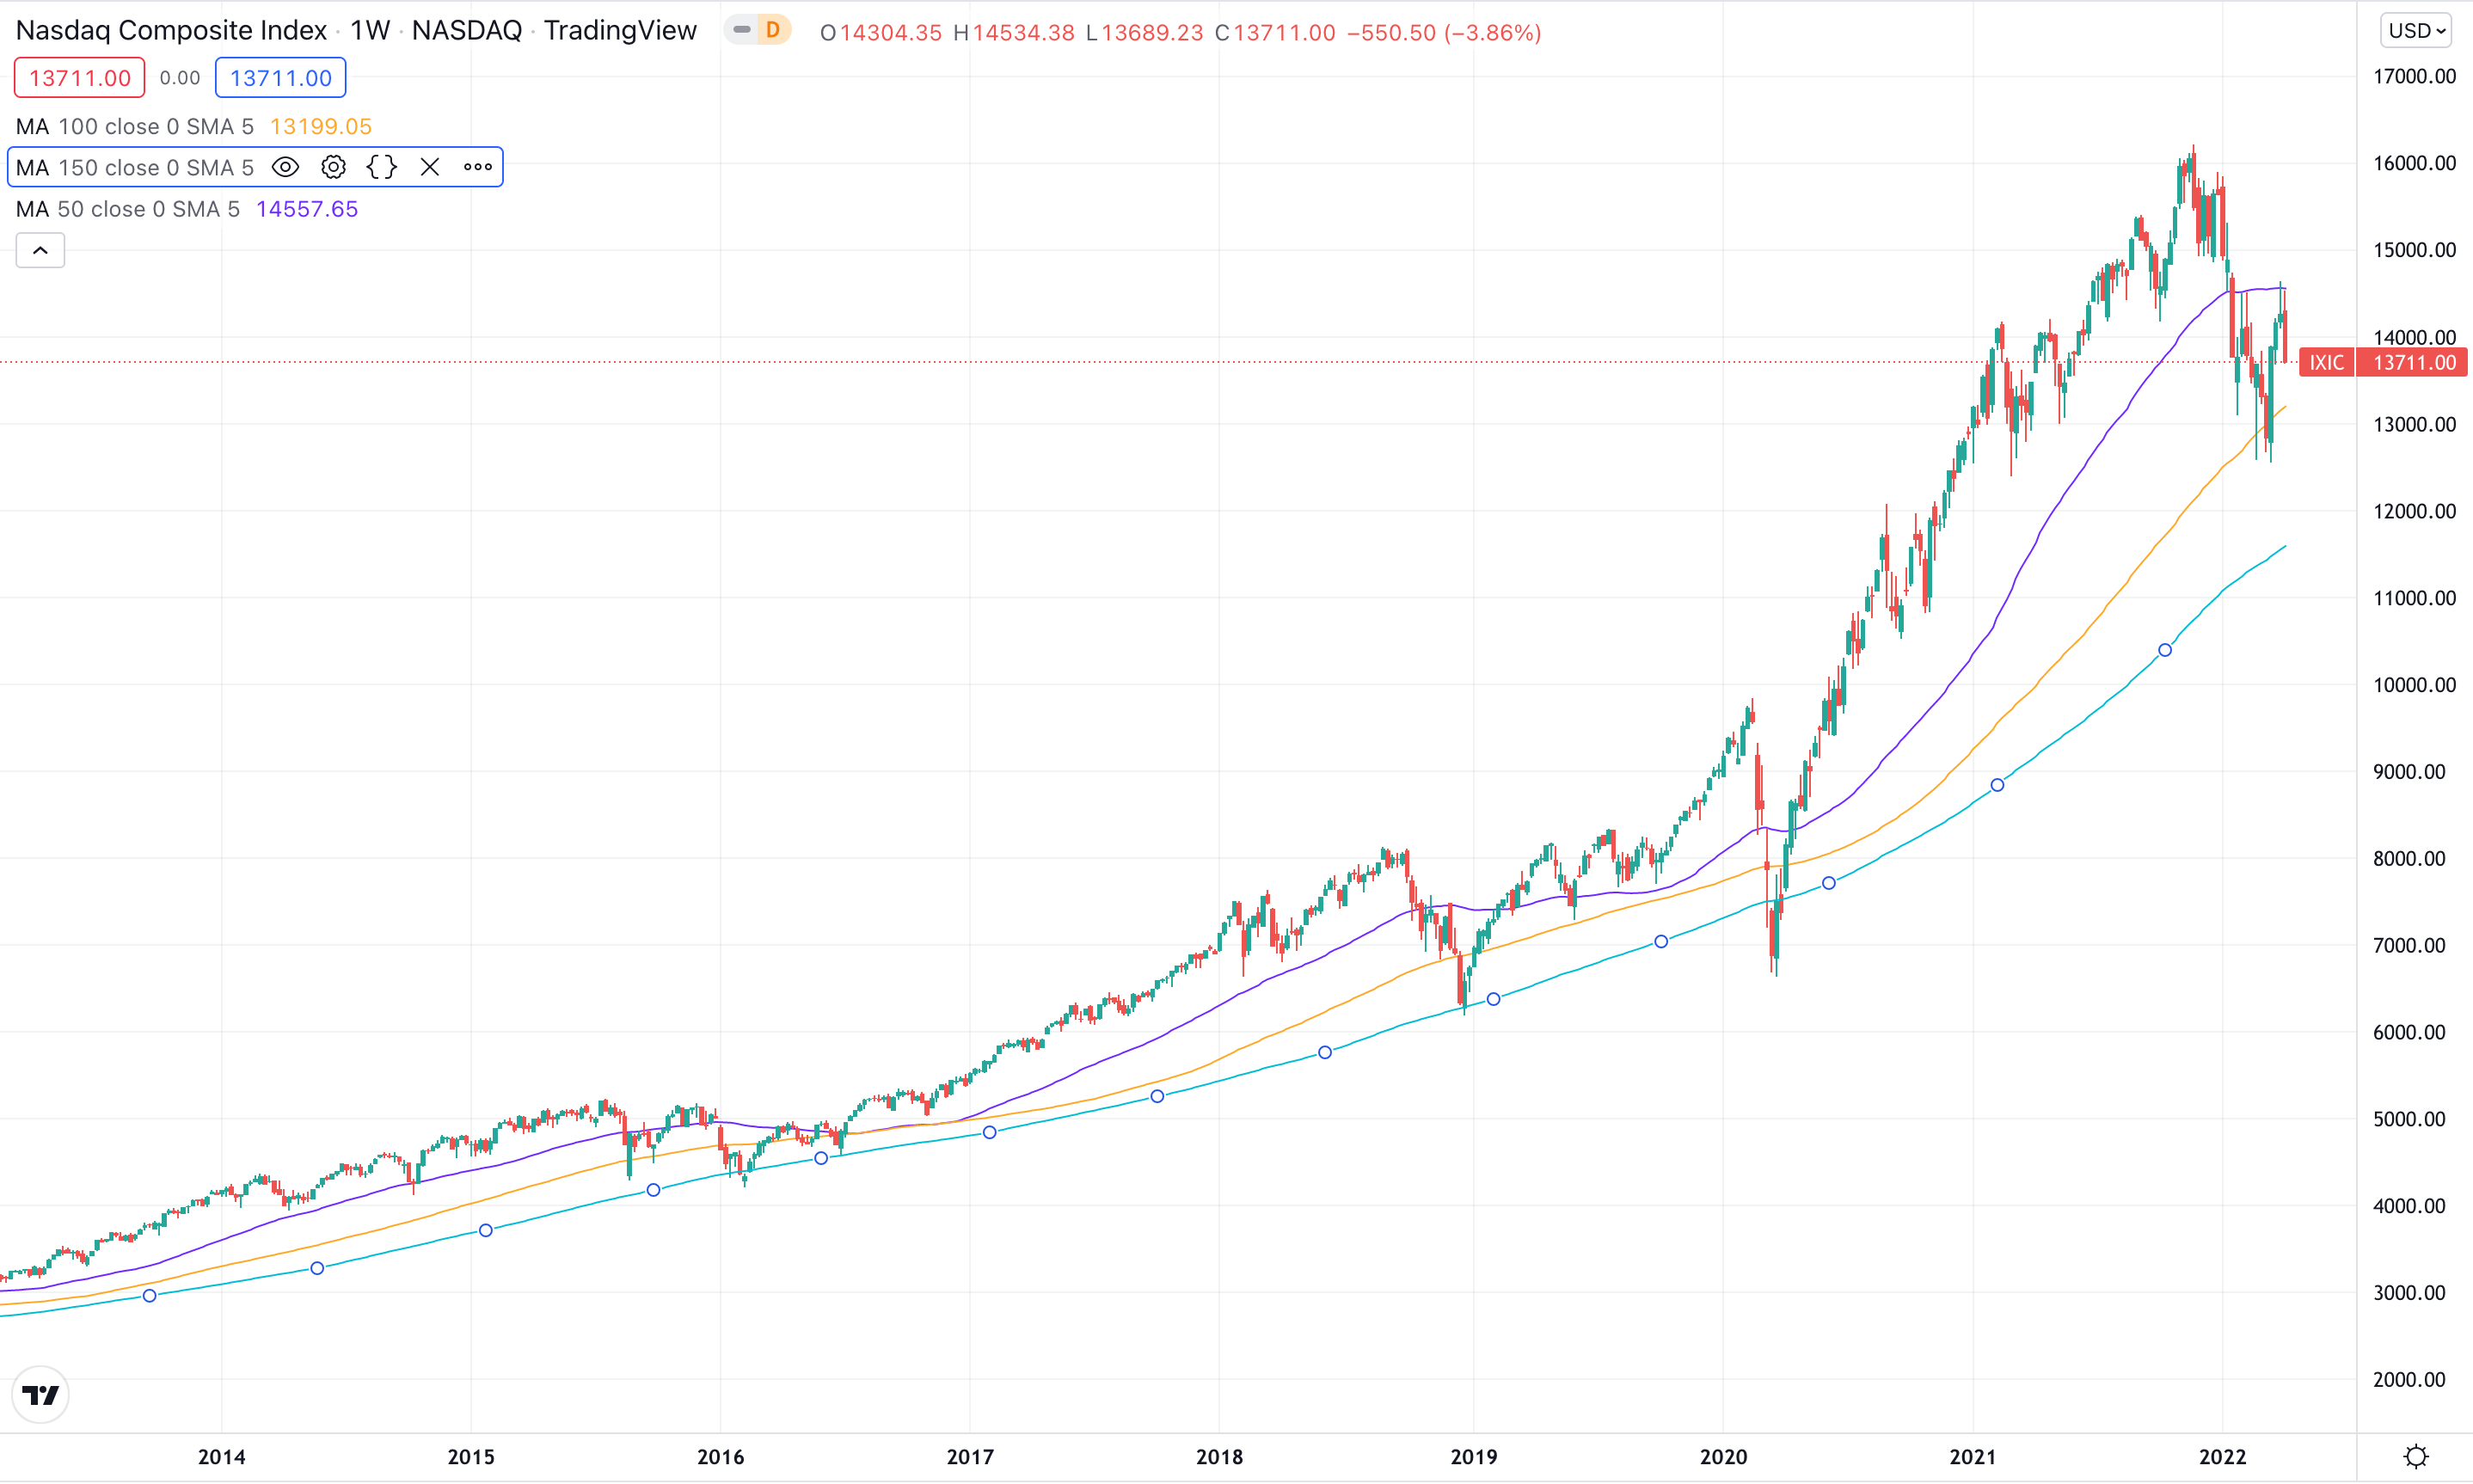
In both 2016, and 2018, those were technically similar in the sense that they were market corrections that were the result of a Fed tightening cycle and both reached the 150 week moving average. I don’t imagine this not being the case now. However, it won’t just be a straight shot downward as most would like to suggest. It would be a much more likely scenario that the markets actually trade sideways for the next couple years.
This thesis is a big reason why I coined “2022 year of accumulation”. The technicals, macro and investor sentiment all justify a cool-off period after rallying very hard for 2 years. Trust me, this is what is best for longer term portfolio returns. Markets can’t just go up or they become unhealthy and secular bull markets die.
Notable above is how the 50 week moving average acted as a line of resistance, this was a similar technical indicator to the 2018 market crash. This would lead us to believe that the markets are respecting the newly developed downward trend. This means we still have time to accumulate shares in our favorite companies.
The 100 Day Moving Average is Significant to Watch
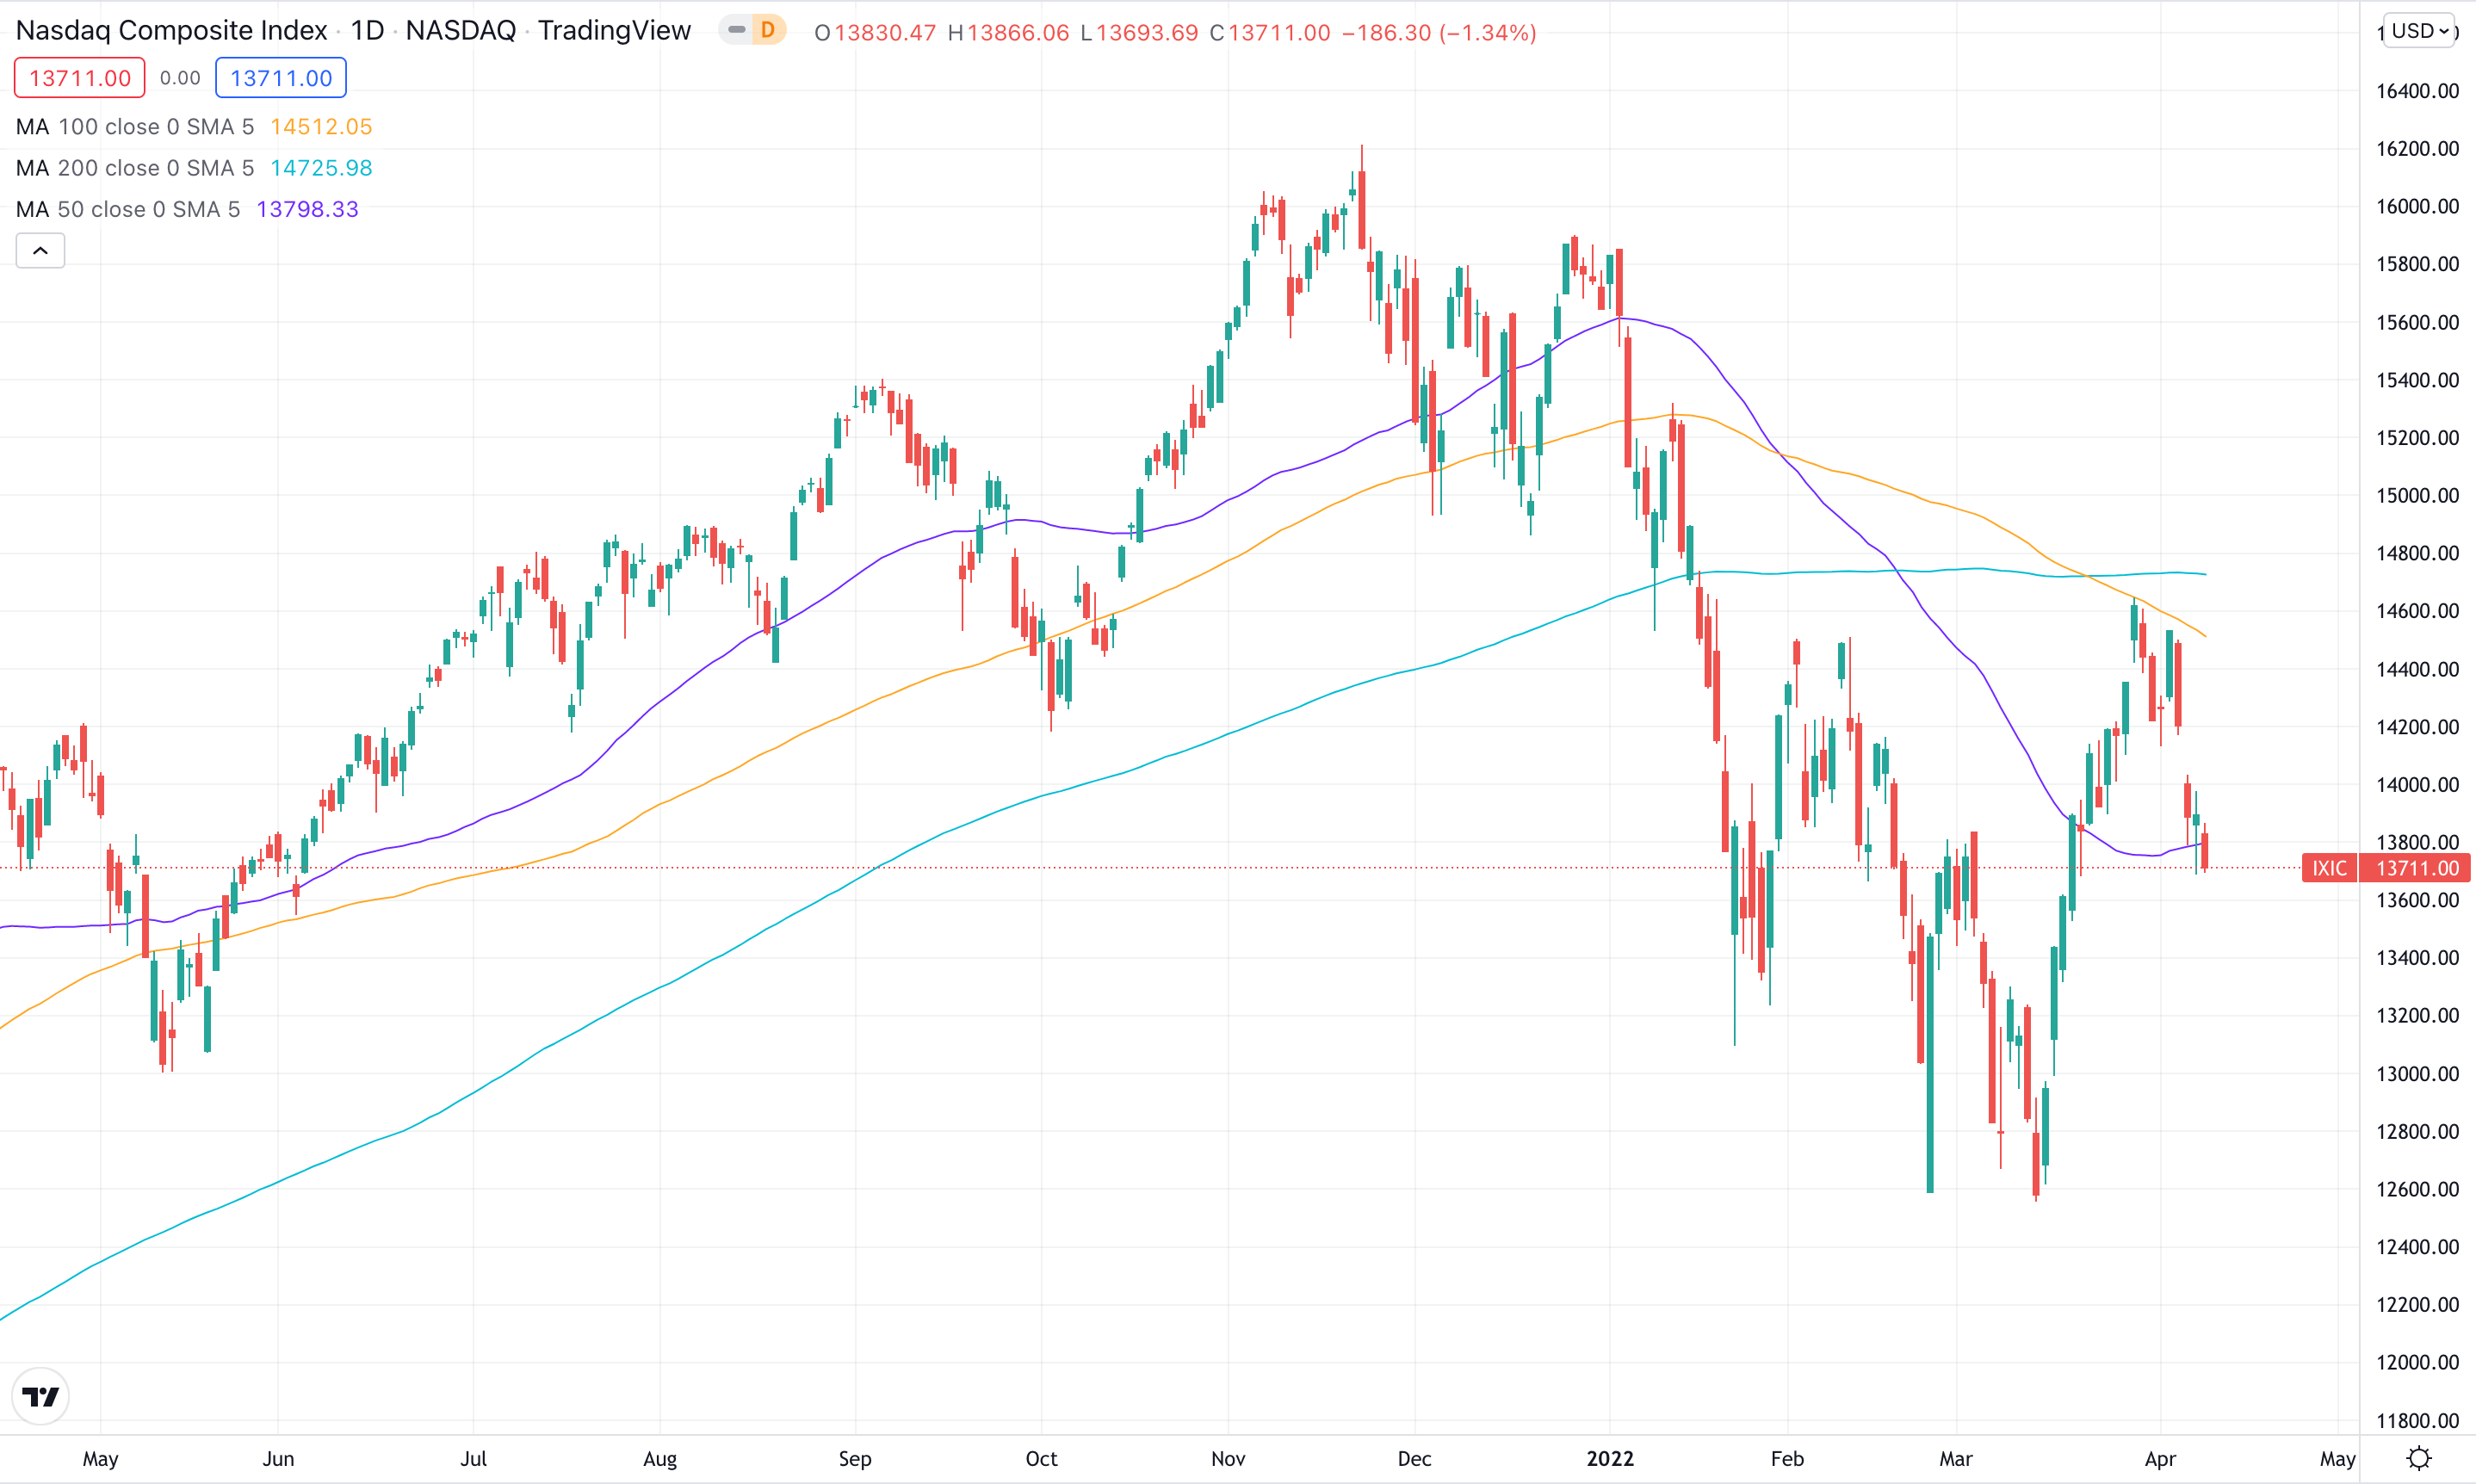
Like I mentioned above, I don’t know why these technical moving averages are significant but they usually are. On the daily chart, the NASDAQ $IXIC Composite was rejected at the 100 day moving average (with the 50 week moving average) before heading back downward. Moving forward, this is what we should be watching, especially if I am wrong and we form a higher low here.
We can use the 100 day moving average as a signal to an ending Bear Market and a newly developing Bull Market.
MACD and RSI Look Like They Want to Go Lower
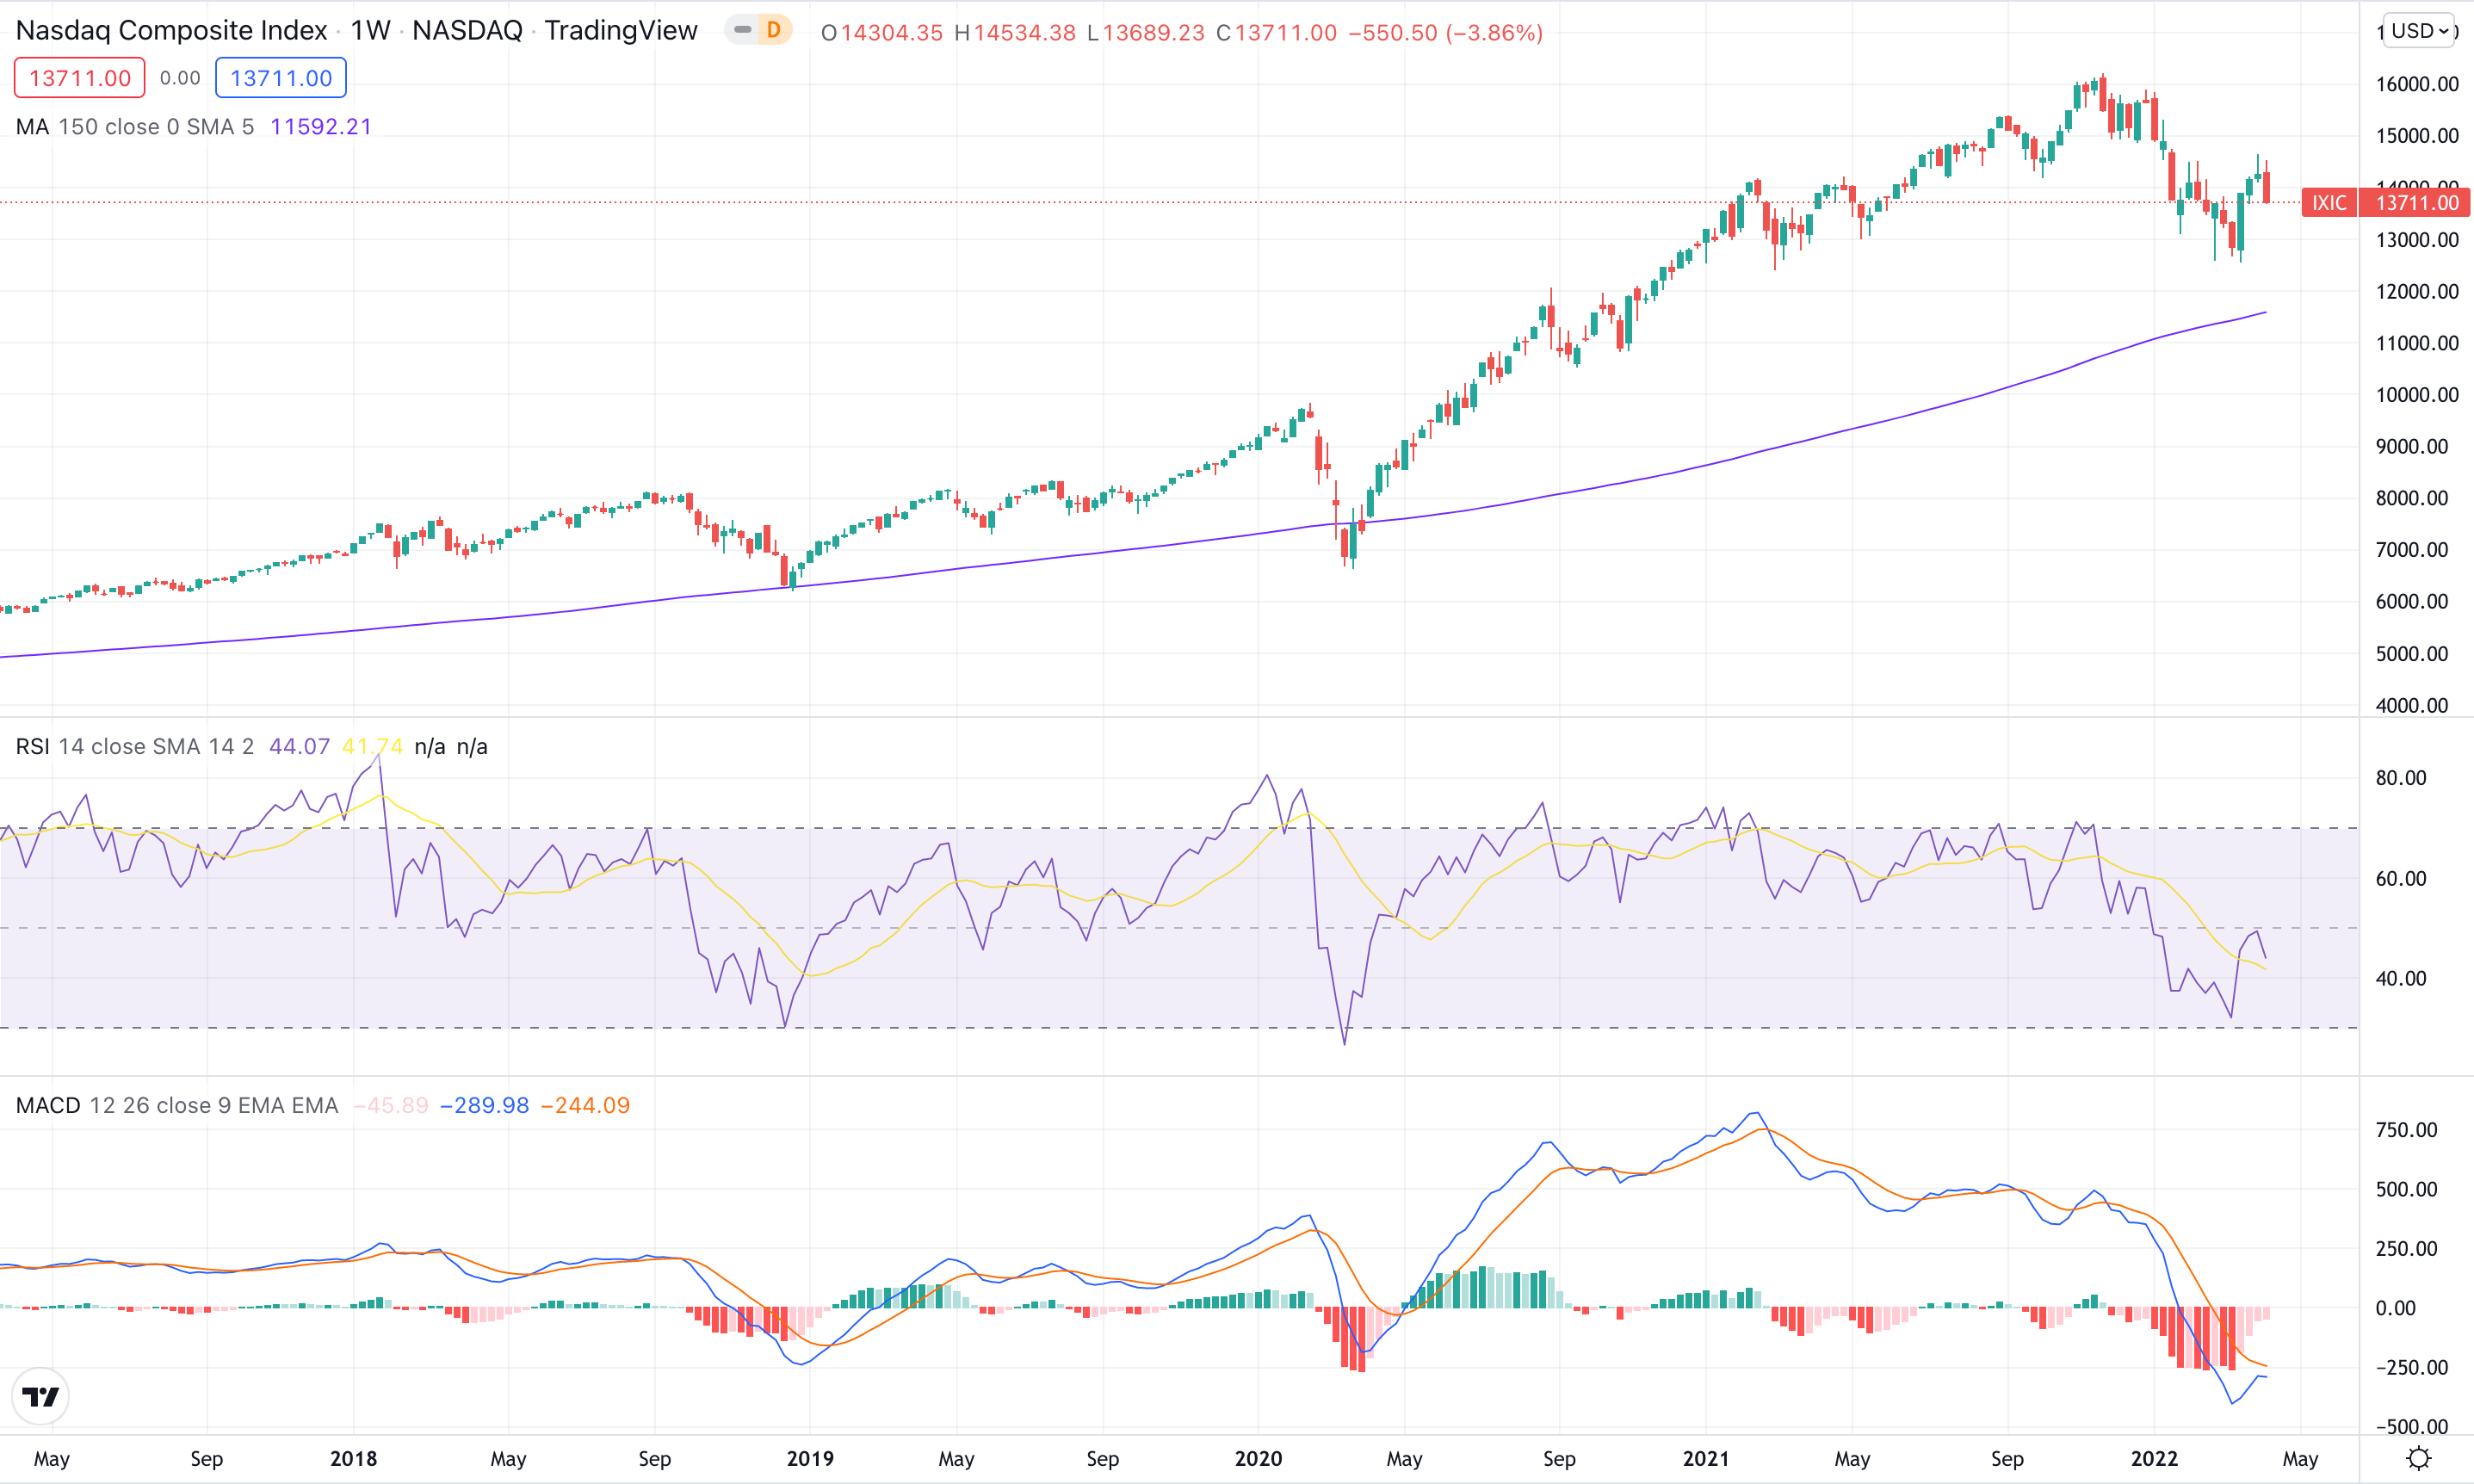
The MACD (bottom chart) and RSI (middle chart) are two technical indicators I watch to identify short to medium term trends in the markets. On a weekly basis, the MACD did originally look like it was curling upward (which would signal a reversal to all time highs) but it’s curling back downward along with the RSI. This is a bearish development, as it signals that the downward momentum is still strong. We wont know for sure, till it happens, but this could signal that we have not fulfilled the major lows just yet this year.
The Monthly Chart Tells Us the Truth for What We are Looking For
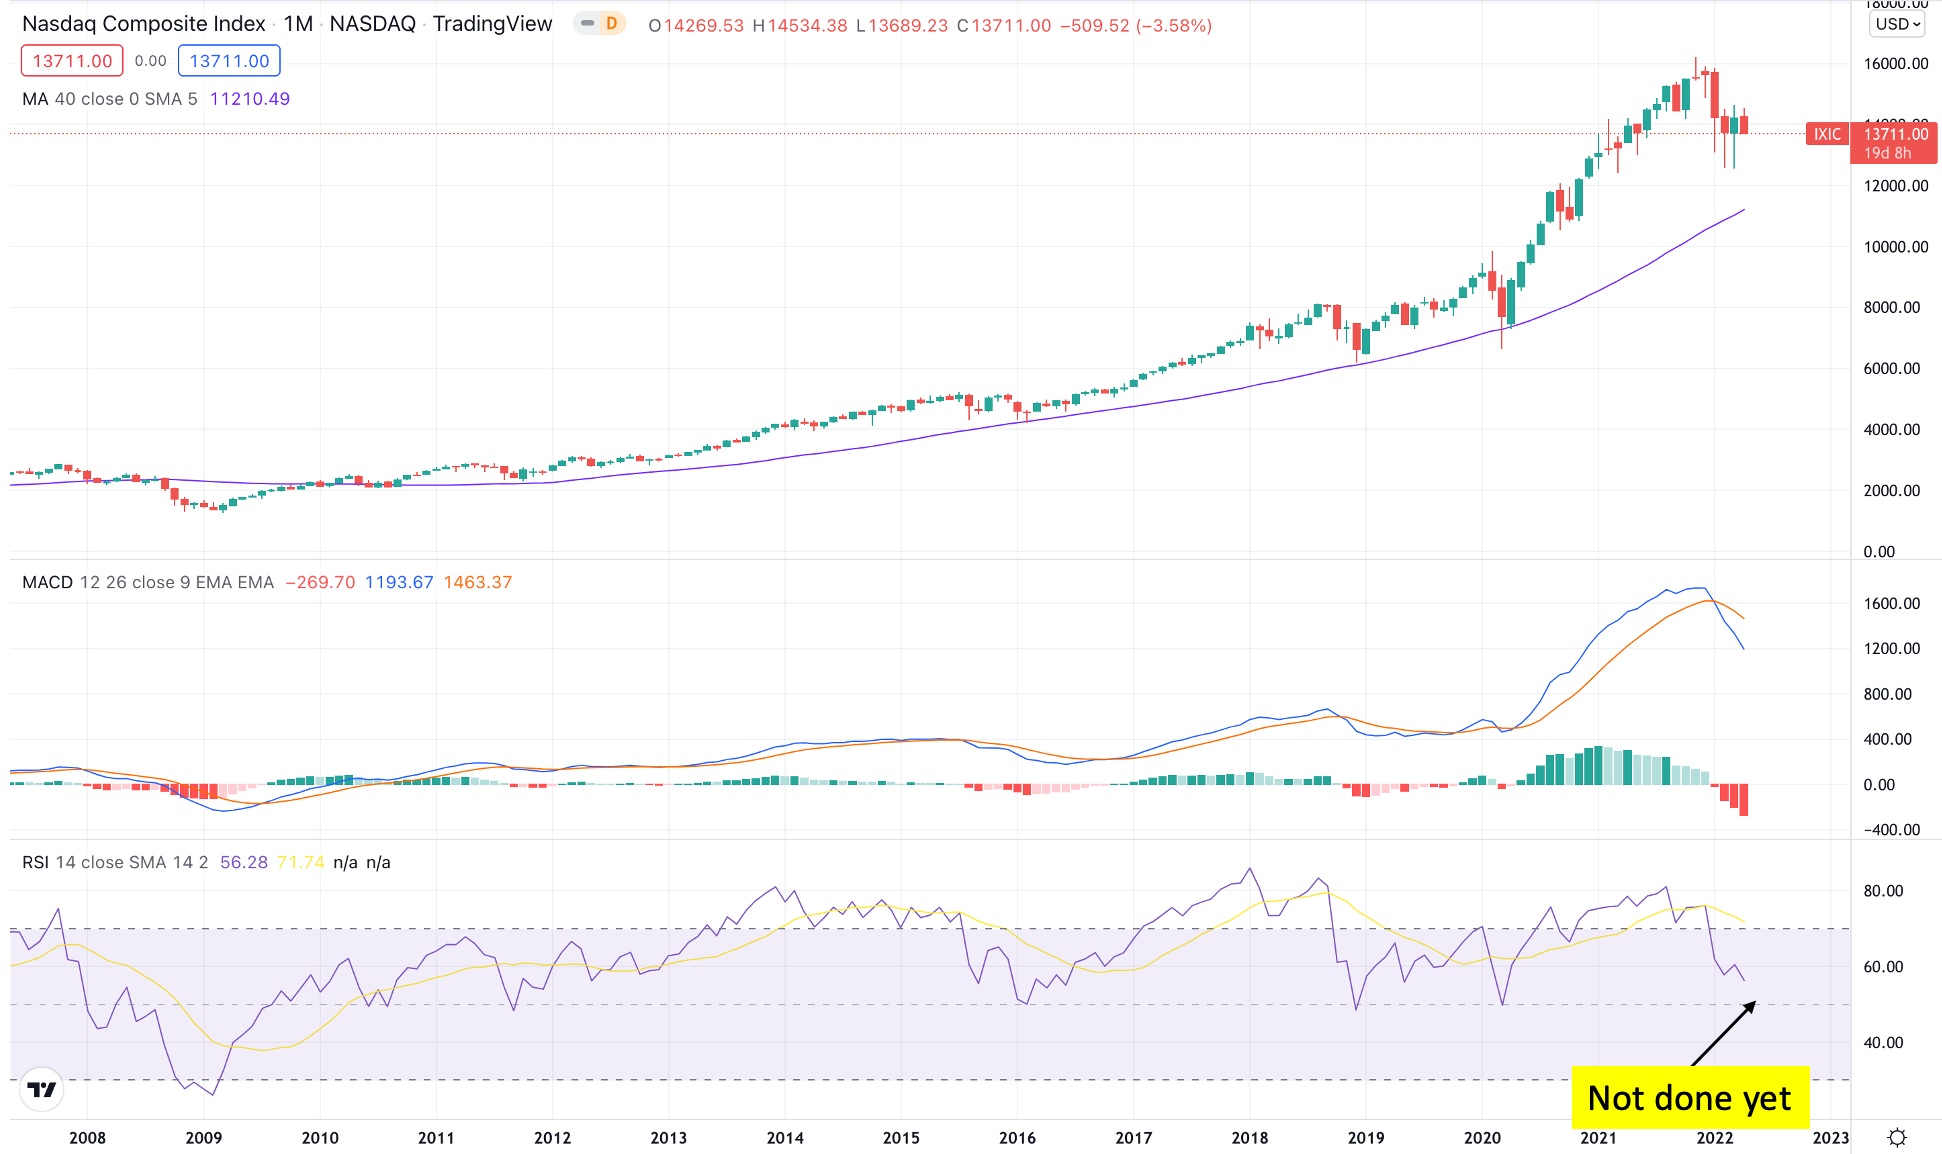
It is worth the observation that all bear markets since the 2008 global financial crisis saw the monthly RSI bottom at 50 (highlighted arrow). It’s interesting to see that this happening in 2011, 2016, 2018 and even 2020!! Pretty incredible to see that sort of trend emerge. I always mention that longer term trends are substantially more important, and stronger, than short term trends. In this case, on a monthly basis, this is signaling that we are not done with this bear market yet and the low still is not in till the 50 RSI is met.
Below the 50 monthly RSI is a major red flag and likely to signal that we are in a much longer lasting bear market than most anticipate. This happened in 2000 and 2008.
How I am Interpreting this Data and What I Plan to Do
Trend favors more downward pressure and this isn’t an environment you should be investing any money you need within the next year (this includes margin). However, from my perspective I do anticipate on buying more stock this week. Personally, I am excited about this opportunity from a long term perspective. What this market is granting us is the ability to buy, what would other wise be really expensive, stocks at discounts from their historical mean valuation.
When you throw CPI data (which is going to come in high) on top of down trending technicals on the market, it seems to be that we should brace for more downward volatility. If I had to put odds on it, I’d say 60% downside this week and 40% upside in terms of probabilities.
Focus on cash flow generating activities this week, don’t expect too much from the markets, think long term and if your business is growing revenue, earnings and cash flows you don’t have much to worry about. We have earnings season coming up which can help provide conviction and validation of thesis on underlying business performance. I will certainly cover and discuss all stocks that are in my portfolio.
Stay Tuned, Stay Classy
Dillon