Reading the Financial Markets - Recession Today
Financial (Equity & Bond) Markets are Signaling What Consensus is Missing
Bullish or bearish, it doesn’t matter. What matters is what “is” and not necessarily what you want it to be. To figure out exactly “what is” and to cut through what bulls and bears are saying (obviously I am bullish today), we have to look at the cold hard data for “what is” rather that perception of what we want it to be.
See… What happens during market cycles is that narrative is often formed around price action, not reality. Reality is often different from perception not only just in the financial markets but in the world. “Our worlds” (in this case) could be defined by our relationships, our jobs, our social media accounts, the news or even the sports we watch. It’s the individual instances we each experience. For the most part, it’s intelligent to go along with the “narrative”, the perception, and to “swim with the fish”. The financial markets… now this is a different story. Here, it’s wise to be optimistically different.
Have you ever noticed how how the greatest investors are often different? If you haven’t read the book “Richer, Wiser, Happier”, it mentions how great investors are sometimes (not all) on the autism spectrum and have a form of “Aspergers”. The book is full of the mentalities and mindsets of wealthy investors, over time and how they behaved during market panic’s like 2008 and 2020. It brings up how, often times, it pays to be different. Even Warren Buffet didn’t involve himself in the news flow of Wall Street and focused on just “buying good businesses” while assuming the best, coining the phrase “don’t be against America.”
I assume these individuals historically perform well because they are able to decipher reality vs perception, or facts vs narrative. They are comfortable being different and are ok swimming against the fish. The often rely on data (or business fundamentals) to make decisions rather than the opinions of others, the crowd, or the media.
In today’s news letter, we are going analyze exactly what’s going on in both the stock and bond markets, the cold hard data. We will examine what various sectors are doing, the trends, as well as what the yield curve looks like and compare it to past inflationary market cycles. Along the way, I’ll interpret what this means to the investor and how it can be applicable to risk/portfolio management also, provide context how interpreting this data correctly can have a form of predictive power. Here’s an idea for the format this will be in:
S&P 500 trends and the predictive power of using markets to make economic assessments of the future
Analysis of defensive trading sectors: Healthcare, Consumer Staples, Utilities and Financials
Recent price action & resilience with consumer discretionary and technology sectors
Bond market, the inverted yield curve and what it’s signaling to us about the future for Fed policy
The biggest risk I see to invalidate the market bottom thesis for 2023 - a teaser for the next publication
Analysis of Different Sectors
The economic/stock market relationship is as old as markets themselves. There are periods of stock market expansion, contraction and everything in between. To fully comprehend why this happens, you must think about the very role of Wall Street in the financial system. It is to manage, gain and protect wealth for high net-worth individuals.
Over time, there have been many different strategies that have emerged on “how best” to manage wealth but the psychology and business that all investors find themselves in is the business of “predicting the future” in some way. As Stanley Druckenmiller often says, “I don’t really know what’s going to happen but it’s my job to, so I’ll make a comment on it”. Or on the infamous movie “Margin Call”, where John Tuld (the firms CEO) claims that the reason why he makes the big bucks is that his job is to know when the music is going to stop a week, a month, or a year from now. His whole role is to predict what the markets will do next, so is Stanley’s, so is ours.
What’s fortunate is that, in 2023, data has never been so accessible to all investors, including individuals. For the most part, with the exception of Bloomberg terminal, we have a lot of the same information as institutions and money managers. The same earnings calls, same charts, same Fed chairman, same economic data, etc. The problem, that I see, is often knowing where to look and how to interpret the given data that we have access to. More importantly; what it even means and how it can help all of us predict the future.
Now, if you’re still with me here, as I speak about something crazy like predicting the future, we are going to talk about not necessarily predicting the future but making an extremely educated guess. For example:
Let’s say you go see a friend and complain about a particular pain in your side. It has been bothering you off and on for weeks and you tell him that. He says, “bro, you probably just worked out too hard from the squats we did yesterday”. Would you believe him? Do you trust his analysis? His assumptions?
Let’s assume the same situation but this time you go and visit a Doctor. You tell him, the Doctor, that your side as been bothering you off and on for weeks. In response, he takes a few tests and comes back with the conclusion that you likely have a kidney stone. Would you believe him? Do you trust this analysis?
The Doctor in this example wouldn’t really know for sure that you have kidney stones unless they took some sort of MRI to visually see what could be the kidney stone. However, the Doctor can be as sure without being 100% confident. It’s more along the lines of 90% confidence that you have a kidney stone. Us, as people, would be inclined to trust such expertise and data analysis.
Paying attention to certain sectors and certain markets allow us to make educated assessments about what is happening in the economy and, in response, what will happen with the next few quarters of corporate earnings (which ultimate drive stock price). Combine this with the Federal Reserve policy, inflation and unemployment we can make a pretty damn good (educated) guess about what the future holds. To see the macro theory I have, I have to refer to you to my last “Market Outlook” letter.
This last letter did a great job explaining the market cycle we are in, history, and macroeconomic data. However, it doesn’t include what we will talk about here today which will be the analysis of various sectors within the financial markets and the interpretation of what bread crumbs are being left behind by “smart money”.
The S&P 500 Trends
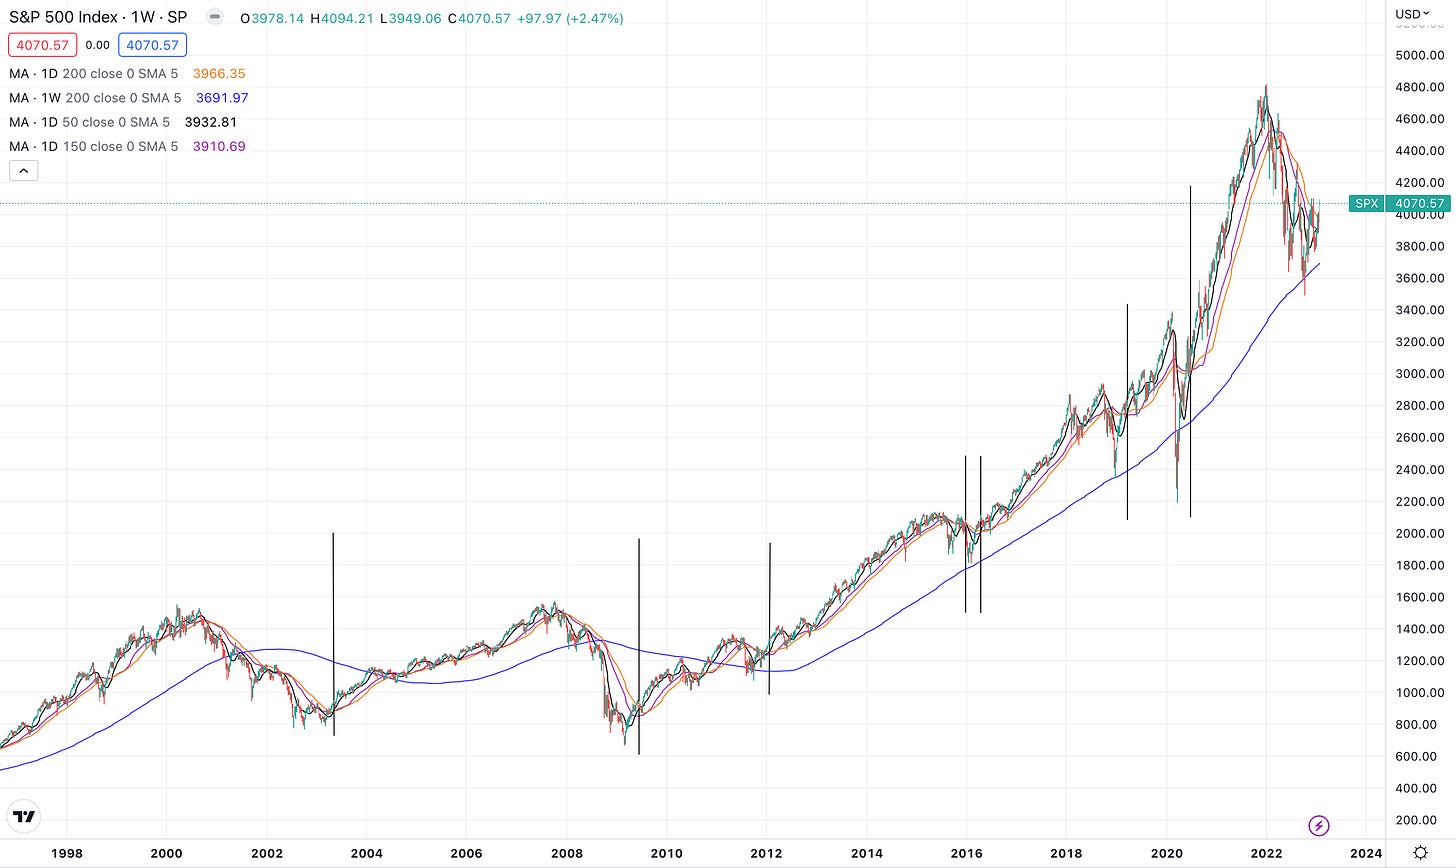
On Twitter, it has to be every day, I see somebody post an absolutely random chart that is meant to have some sort of predictability that is usually followed with some sort of bearish insinuation, lol especially in 2022/23. I think few charts are more telling than the trend of the S&P 500. More importantly, the interpretation of the longer term moving averages. A rule of thumb is that the 200 week moving average marks a longer term, usually secular, trend. The 200 day moving average marks some sort of cyclical (shorter term) bull/bear market trend and then we have everything in between. There is one particular signal, using the moving averages, I wanted to bring to your attention.
That is the 50 day moving average crossing above both the 150 day and 200 day moving averages. This has signaled the beginning to a bull market every time since the 1960’s. Let me mark the last few times this has happened. It has only produced 1 false signal in the past 7 major market corrections/crashes.
You can see that it produced a false signal in 2015 (nothing is perfect) but marked the beginning of the bull market to follow post 2002 and 2009 market bottoms. Let’s go back further in time to test this indicator.
I went all the way back to 1966 to test what happens when the 50 day moving average crosses above both the 150 day and 200 day moving average. You will find that it has market a bull market every single time. A bull market in this case is a prolonged (multi-year) 20%+ up trend in the S&P 500.
We Can Assume, With Over 95% Confidence, that the 50 Day Moving Average Crossing Above the 200 Day Moving Average Will Signal a Multi-Year Bull Market.
Now that I shared one of my favorite signals, let’s take a look at what the other sectors are saying about the future market direction, the economic cycle and identify exactly where we are at.
What Stock Market Sectors are Signaling
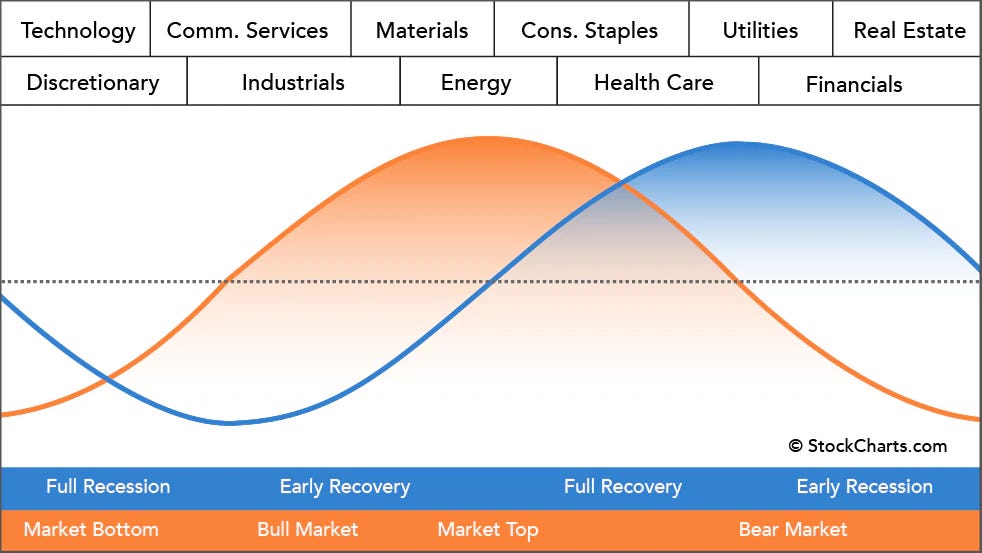
This is where it really gets interesting. There is a clear bifurcation between narrative, the yield curve and what the markets have signaled already. Historically, equity markets move in advance to the economic market cycle. As you can see above; Energy, Consumer Staples, Utilities, Health Care and Financials perform best at the economic peak despite a stock market correction/crash already underway. The trough of the bear market, however, is marked by out performance in Financials, Real Estate, Consumer Discretionary and Technology. So let’s take a look at what’s performing, what’s been performing and what has not.
Energy - The Bellwether
Recently, I posted a newsletter saying “Short Energy, Long Tech”. This was a trade idea that, needless to say, didn’t exactly work out because energy hit near recent highs last week. The analysis essentially said that, because of the economic cycle energy was a short due to contracting economic conditions. But it was swing and a miss because the fundamentals of oil prices and energy stocks (specifically) support higher stock prices. The reason why; these top oil and gas companies (Chevron and Exxon) are doing record stock buy-backs while government policy has bottle necked supply (creating higher gas prices). I was wrong, regardless, the sectors performance and strength is note worthy as it’s still above the 200 day moving average.
The war in Ukraine, government policy and under investment in the the energy space will keep oil prices higher, at least in the short term.
Consumer Staples
Traditionally a “defensive” sector, consumer staples hold up relatively well during periods of economic turmoil. In economic recoveries and market bottoms, they are usually the first to recover to highs but tend to under perform the S&P during periods of economic expansion where technology or consumer discretionary usually leads. In today’s instance, we can quickly observe consumer staples’s strength and subsequent recovery after the October lows. What’s notable is this years under performance in relation to more riskier sectors (I will cover this in a second).
Healthcare
Healthcare stocks are a lot like Consumer Staples where they are relatively un-volatile compared to the S&P 500 during periods of market volatility. What’s interesting is that they were really only impacted during 2008 but did not participate in the bear market of 2002, this traded side ways during the TMT bust. Today, XLV 0.00%↑ (healthcare sector ETF) is trading above all major moving averages after October and June's low.
(Note recent under performance)
Utilities
The utilities sector is one of the best proxies, for what I have found, to identify stock market capitulation. Historically, this sector is considered the “risk off” or defensive sector of choice. The thought process is that American’s need to pay their utility bills, right? It takes a lot of market fear for investors to capitulate their utility stock holdings. Today, we see a similar trend of weakness to start the year (compared to “risk on) but is still up meaningfully off the lows from October.
(Note recent underperformance)
Financials
Historically, financials are one of the first markets to recovery but the data is not always going to be reliable. For example, financials essentially didn’t participate for years after the 2008 global financial crisis. I place less reliability here and believe it reflects more sentiment towards stability of the financial system more than anything. If investors become nervous about a liquidity crisis (like 2008) we could expect financials to be one of the sectors to get hit hardest. Today, financials are in a bullish uptrend and are above all major moving averages, which is optimistic for the bulls looking for a market recovery.
(Note recent out performance)
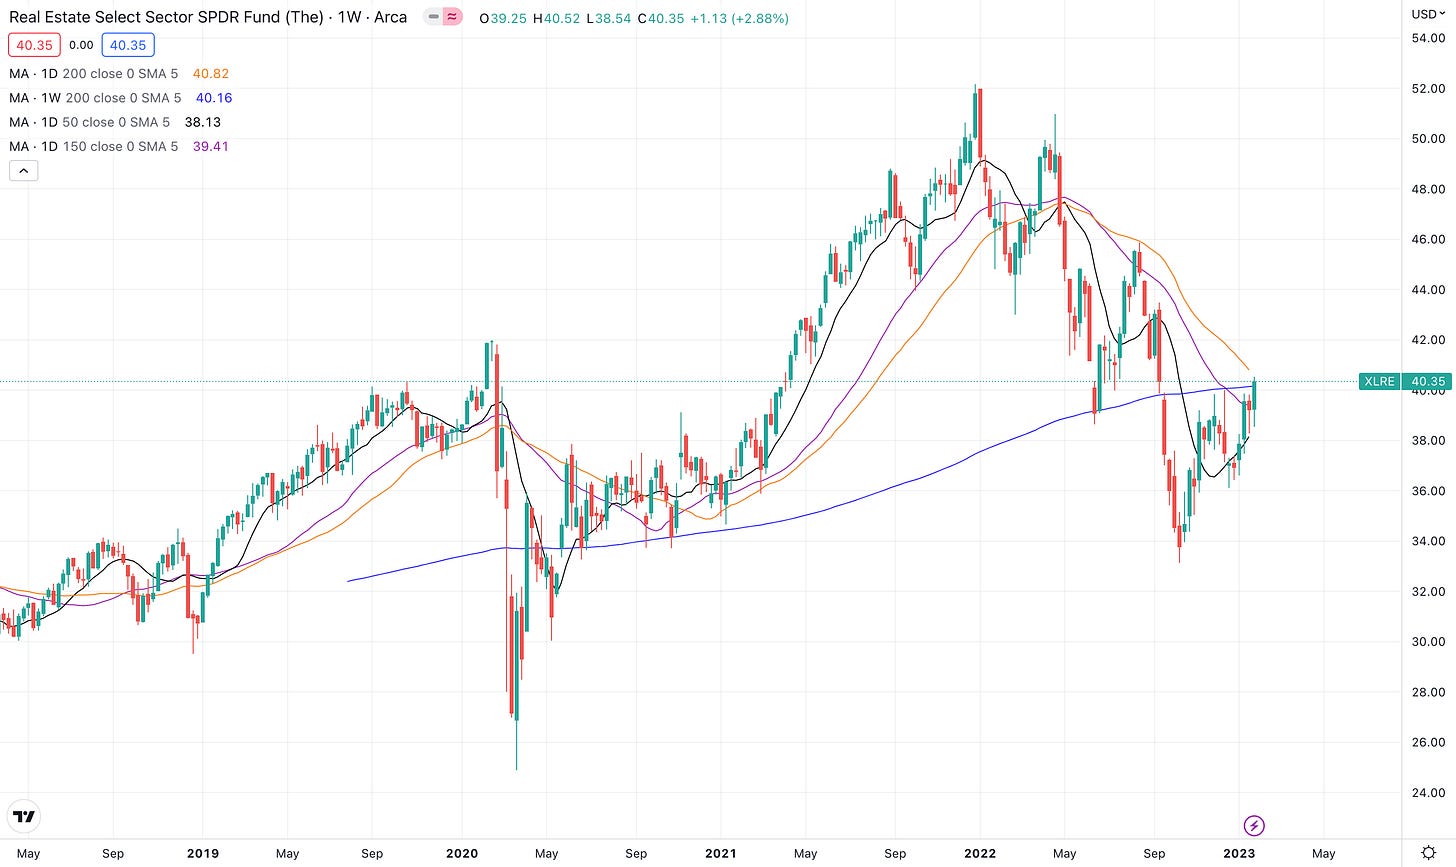
Real Estate
Real estate, if I am not mistaken, is somewhere around 17% of GDP which is a massive part of the economy. Typically, Real Estate stocks will rally on market recoveries because this means that the future economic outlook is positive after a market crash or economic contraction. Notice how the real estate sector declined more (further) than it did during the COVID-19 pandemic but has recently been outperforming, crossing above the 150 day moving average and above the 200 week moving average. This shows out performance and recovery as of recent.
Consumer Discretionary
Usually considered a “risk on” sector, consumer discretionary has been absolutely whacked during this market crash. XLY 0.00%↑ has tried to bottom twice, once in June and another time in December where it quickly recovered. The picture here from a trend perspective is cloudy because it's negative and doesn't look great but finds itself in a very important week with Jerome Powell talking and every opportunity to turn more optimistic. Note the recent out performance but also note how it's approaching a crucial area of resistance with the 200 week and 200 day moving average. We could get rejected here but the price action is the price action and it’s out performing defensive stocks recently.
Technology
As many of you know, this is the sector I prefer to invest in because of its long term secular trends. The picture today is optimistic as it has been recovering with the S&P 500 and is notably above the 200 day moving average (something that has happened this bear market) and bounced right off the 200 week moving average. In my opinion, this is the most important sector and is crucial for the S&P 500 to continue its uptrend. Today, technology is about 20%+ of the S&P 500 weighting and contains stocks like Apple, Microsoft or Amazon. It appears technology has crossed above all major moving averages and could be moving toward a new bull market.
(Notice the out performance recently)
Bonus - Software Stocks
Tech isn’t just tech, as many Wall Street guys may think FAANG and stop at that. You need to include software and other emerging businesses. For this, we can look at the IGV 0.00%↑ ETF that tracks this sector. Today, this price action has been very optimistic for the likelihood of a new bull market. Despite undercutting lows, trading above the 200 day moving average is extremely optimistic. Notice the outperformance vs the defensive sectors recently.
By Combining all these Markets - Recession?
In each market section, I noted recent out performance or under performance. The reason why I did this was to note money flow out of defensives and into more “risk” assets. Technology, Discretionary and Real Estate have been out performing the more “defensive” sectors so far this year (2023) which could tell us that we are in the middle of a recession and are at the back half of the bear market that could be recovering.
In The Middle of Recession?
Yes, I know it sounds unusual to say that we are in the middle of recession especially since consensus has it that we are still going to see one. But, the markets are the markets and what “is”, is what “is”. We are finding that sectors that begin to perform (technology, real estate & discretionary) on market recoveries are now trading above their 200 day moving average and have shown relative strength over defensives. It’s not just the equity markets signaling we are in recession either.
I shared specific macro data (ex unemployment) that signals we are in recession today in this thread.


It is almost impossible to know exactly when we are in recession until it’s too late. Historically, it has been marked by 2 consecutive quarters of negative GDP that has marked recession (which we got in 1H 2022). Even in the second worse recession in US economic history (second only to the Great Depression), the NBER did not officially declare a recession till December 2008! Three months before the markets officially bottomed and one year after the recession began!
The equity markets are signaling, if the trend currently continue’s, that we have been in recession since 2H 2022 and are about to exit recession over the next 6-9 months.
What about the Inverted Yield Curve? The Signal Macro Bears are Waiting for.
Historically, the yield curve un-inverts just before a recession begins…. Unless… We are in an inflationary market cycle. During 1980 - 1982, Volker said, many times, “higher for longer” and “keep at it”, which Jerome Powell has said during his recent speeches. That means that this time isn’t different, it’s consistent with what happened in the 1980’s when the Federal Reserve crushed inflation and inflation expectations. Below, you can see the 10 year yield and the 2 year yield didn’t un-invert till the middle or back half of the recession.
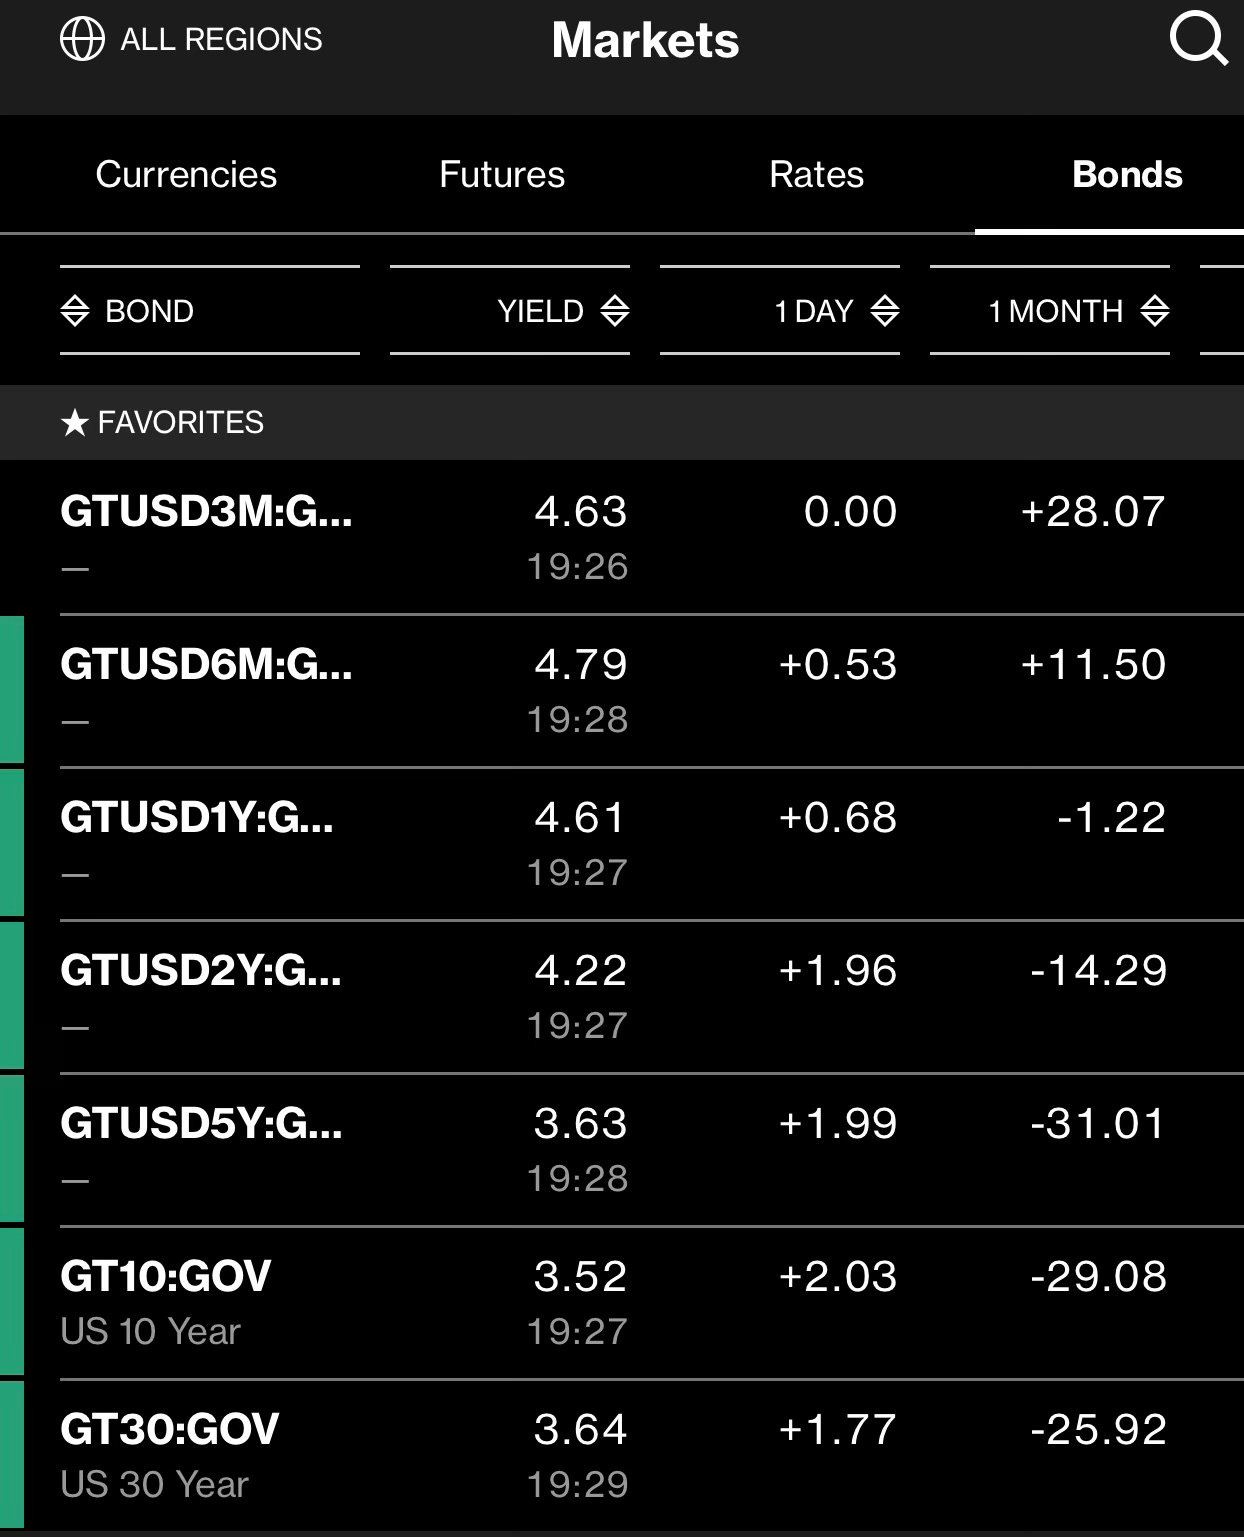
The Bond Market is Actually Saying this About the Future Fed Policy
The Bond market is currently in the middle of an un-inversion process. Notice how yields are peaking at the 6 month mark at 4.79%, this isn’t by coincidence. It is telling us that the Fed will raise to 4.75% on the Federal Funds rate and immediately cut before the end of the year. If inflation falls faster than expectations, this un-inversion process will likely speed up.
Current Fed Rate Hiking Expectations, Unemployment Rate and Inflation
If Core Inflation Falls Faster than Expectations, Rate Hikes Will be Quickly Revised Down and Unemployment Wont Rise as High. A Soft Landing.
Bringing it All Together - Summary
If we start from the beginning to the end of everything we talked about today, it can be simplified by this:
The S&P 500 is about to signal a historically bullish sign where the 50 day moving average crosses above the 150 and 200 day moving average. This has marked the beginning to every bull market since the 1960’s.
The underlying sectors within the S&P 500 signaled that we are in recession today and are currently in the process of an economic recovery in the months ahead because riskier sectors are out performing defensive sectors (which historically lead during economic expansionary periods)
The Bond market is signaling the the Federal Reserve will cut rates very soon as inflation cools. Many other market participants are also waiting for the yield curve to un-invert to signal recession which wont happen because we are in an inflationary environment just like the 1980’s and Fed policy is artificially inflating the short end of the yield curve.
By combining all these together, we can conclude that we are in recession today or some sort of recessionary climate (no idea of the NBER will every officially declare a recession) as signaled by the equity markets. The recession is in its final innings and the market is looking forward to Q3/Q4 of 2023 when the Federal Reserve backs off rates and eases monetary conditions to bring us toward an economic expansion phase where inflation is hopefully tamed.
There is One Big Risk, Actually Two, that Still Linger
During inflationary market cycles and, by assessing Fed policy today, there are two major risks today that could send us toward a capitulatory sell off that the broader market seems to think will happen. It won’t be the current trajectory of the economic cycle either. The risk is in the banking system, market liquidity and US Government Policy.
Make sure you’re tuned in for the next news letter that will explain exactly what to look for if you’re cautious about a Vix spike to 60+. It will be a good one.
Until then…
Stay Tuned, Stay Classy
Dillon











Great insights. Thanks!