Emotions run high in bear markets. Often times, it’s very difficult to post analysis because it doesn’t always follow consensus. But, the purpose of this newsletter is to be 100% transparent in my thinking which may not always be 100% popular. In this case, we are going to take a look at a historically accurate bottom indicator and run specific price targets on the S&P on a valuation perspective. At the end, I’ll provide additional thoughts on what history has taught us and which time period this reminds me of.
At the end of today’s news letter you should have a really great idea of where the S&P 500 is going over the next few months.
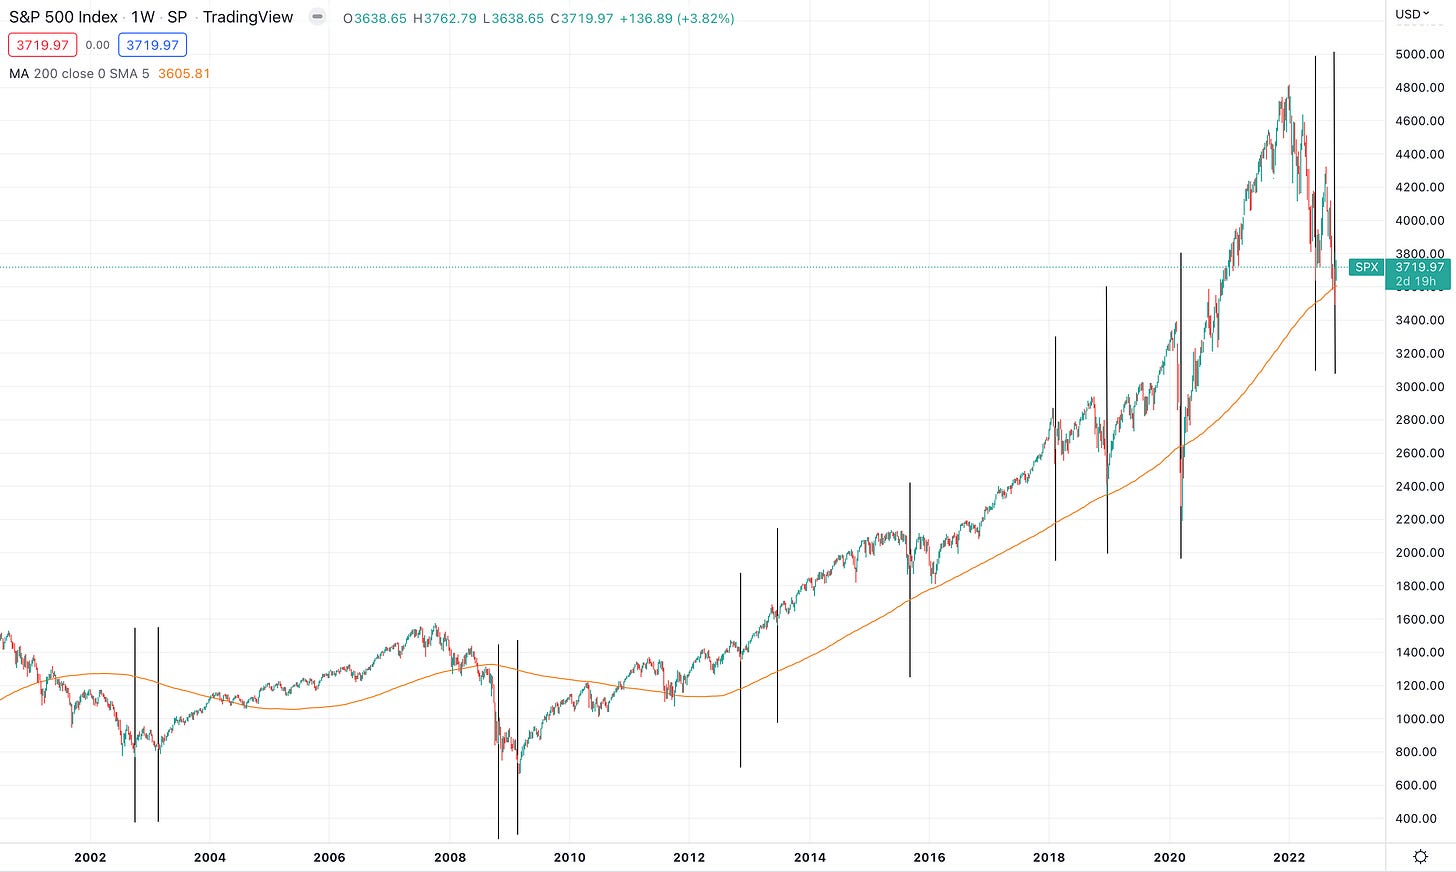
I have recently come across multiple data points that are suggesting we are at the major low and beginning a new bull market. For starters, we can see utilities and the price action recently. Over the past 4 weeks utilities puked/crashed 20%+. There is significance here. This puke of utilities has happened a few other times in the past. Below, I looked at where utilities had this intense crashing price action.
This was interesting to me because these dates seemed like time periods where there was a major low put into the index’s. I put it to the test and cross referenced the exact dates listed above. Below is what I found.
I believe this is significant because it signals what large funds are doing.
The nature of utilities act as a “risk off” investment vehicle. During times of extreme volatility, funds will often hide in XLU (and it’s various companies). For example, prior to the recent dump, XLU was up 9% year to date while the S&P was down 20%+ and the NASDAQ was down nearly 40%. So when XLU capitulates like this, it likely signals major lows because funds (smart money) are flowing money out of safe “risk off” stocks and into the broader indices and “risk on” stocks. This buying puts in a major low. It signals capitulation.
Utilities Capitulation is Interesting but the Real Data is in the S&P 500
Let’s combine both technicals and fundamentals to gauge if this could realistically be a long term bottom. Technicals, although helpful, don’t always tell the full picture and neither do fundamentals. When we combine the two, we get a more complete picture. When conducting this analysis, we are going to assume a few key data points based on where the trend appears to be going.
Inflation comes down in the event of a recession. This is easy to assume considering CPI came down 11/11 times in the event of a recession since the 1950’s. The shaded areas below are recessions.
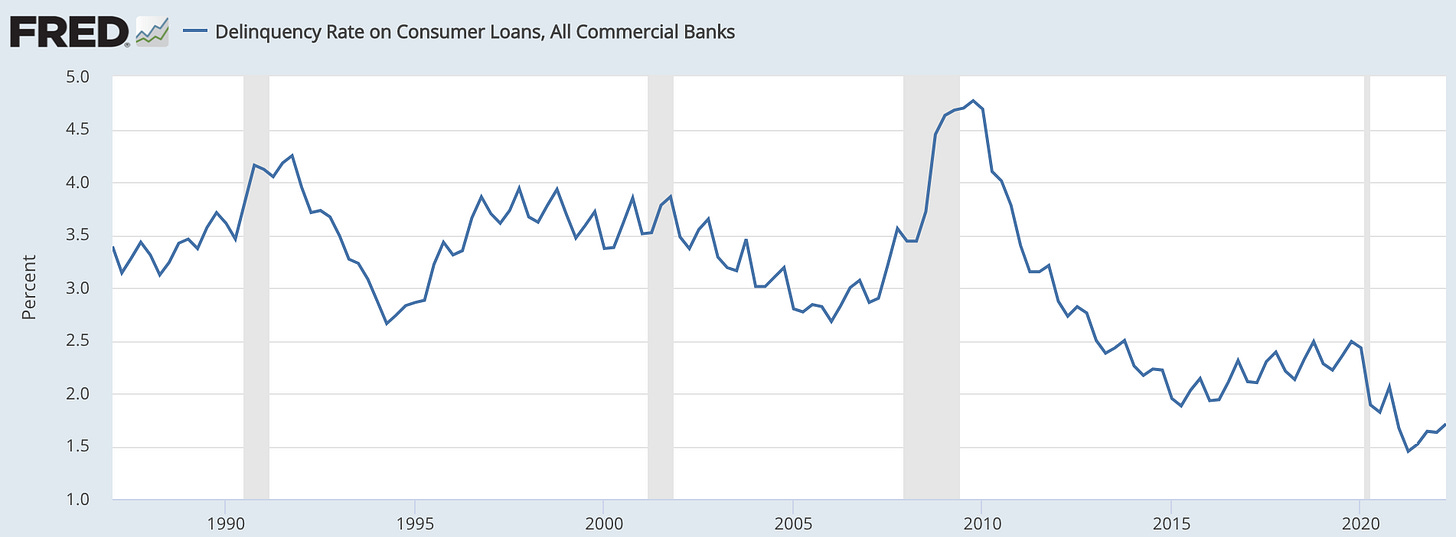
This will be a relatively mild recession because the labor market is starting strong and the consumer is strong. We are way off especially when we think about consumer default rates. Looking at the chart below, we have a long way to go before we even think about getting to 2007/2008 levels. At this current trend, it will take months/years to get there.
The default rate is important to pay attention to because a structural “credit bust” in the financial system is what has created the worst recessions in American history. Other recessions were simply periods of weaker growth and rising employment but was relatively easy for the market and economy to handle.
It is reasonable to think that unemployment will go up in a meaningful fashion, rather quick, in the event of a true recession. But still, our starting point is historically low and should serve as a strong foundation.
I cannot stress enough, perhaps the most important detail of this recession… It is Fed induced (unlike 2002 and 2008) and is coming after the largest economic stimulus and money supply growth IN HISTORY.
This is a massive variable that does change what would otherwise be the historical norm. There is no real play book and it’s all theory based when looking into the future.
S&P 500 Earnings both Past, Present and Future
As I was looking at the 10 year and 3 month yield spread today, I noticed that we are going straight toward the “official” recession mark. Historically, this spread has been right 100% of the time at predicting recessions within a few months. We seem destined to go below that 0% spread line.
A good leading indicator that we will get there is the 10 year and 2 year yield spread in the bond market. Historically, we can see that the 10/2 spread inverts first, then the 3 month yield follows shortly after that. Essentially, the point I am trying to make, it looks like we are going toward an “official recession”.
The Real Question Becomes a Fundamental One. Has the S&P 500 Priced in a Recession?
The only way to make this judgement is, obviously, looking at history to see where the market has bottomed before from a valuation P/E perspective. I find this helpful to look at both the trailing and forward P/E.
Large, Mid, Small Cap Forward P/E
This is the most interesting chart to see because we can quickly see that (on a forward basis) small and mid caps have been blown out down to 2008 levels while large caps have hit the same valuation seen at the bottom of the 2002 recessionary bear market.
But What About Trailing P/E? We are Entering an “Earnings Recession”.
When we look at the trailing P/E, it presents faulty data because the trailing P/E gets extremely bloated during recessionary periods. For example, look at the TTM P/E ratio in the early 2000’s, it nearly hit 45! Same story with 2008/09 P/E ratio, it hit 65+.
When it comes to the markets, it doesn’t matter where we have been, it matters where we are going. The algo’s and fund managers have already priced in today’s news and are in the middle of pricing in the news 6 months from now.
Let’s “Price in” an S&P Target Based on Earnings Expectations and Provide a Recessionary Target
Since using TTM P/E ratio doesn’t help, we have to figure what earnings will be for 2023 and calculate its variability. Currently, per Yardeni and Analyst Expectations we can find the data here:
Yardeni has a projected earnings estimate of 235 on the S&P 500 and Analysts consensus estimates have it at 239.8. Since forward P/E’s account for the next twelve months in the future, this seems about right to be trading here. If we run the math on analysts consensus earnings for the S&P and put a forward P/E of 15 on it, the equation comes out to be:
239.8 x 15 = 3,597
If we use an 18x forward P/E multiple we will get:
239.8 x 18 = 4316.4
On a chart it will look like this:
Basically, we are at market bottom IF AND ONLY IF EARNINGS COME OUT IN LINE OR STRONGER THAN EXPECTED THIS QUARTER. In addition to stronger than expected Q3 earnings, we need to see Q4 earnings guidance come in line or above expectations.
So far we have had a good start.
Now Let’s Price in an Earnings Compression/Recession
Looking forward, we currently have an assumed 9% EPS growth for 2023. This is where it gets tricky. Remember, there is a difference between forward P/E and trailing P/E. That means that as time goes by, the market will begin pricing in earnings projections for 2024, after the recession, and will begin looking toward the recovery. But for the sake of consistence let’s use the average decline (-26%) in earnings for recessions and apply it to today’s example.
Let’s price the decline of 26%. The equation will look like:
239 - (239.8 x .26) = 177.45
If we put a forward P/E of 15 and 18x respectively, this would ideally be where we should be trading today
177 x 15 = 2,661.78
177 x 18 = 3,186
On a chart this looks like:
Here’s the most important thing to know about this price target. This is only in the event that a full recession is priced in today. What we can ‘essentially’ say in todays case is that a full recession is not priced in. If earnings begin to fall and a full recession is beginning to be priced in, we can position our selves accordingly. But, that’s not the case as Q3 GDP is expected to be positive as the labor market stays resilient.
This is What I am Thinking
Bears are right in assuming that an earnings recession has not been priced in and the Fed needs to induce a recession to bring inflation down. However… When looking back at history there has never been a blue print for what happens when the Fed prints a ton of money to create stimulus and then instantly tightens after. This sort of monetary policy phenomenon has never happened before. The only other time frames we can think of where it was remotely close to this were:
2008 - 2010 (massive fiscal stimulus). There were fears that a double dip recession was in the cards, it didn’t happen because of the stimulus and the Fed never tightened. Inflation was well controlled during this period too.
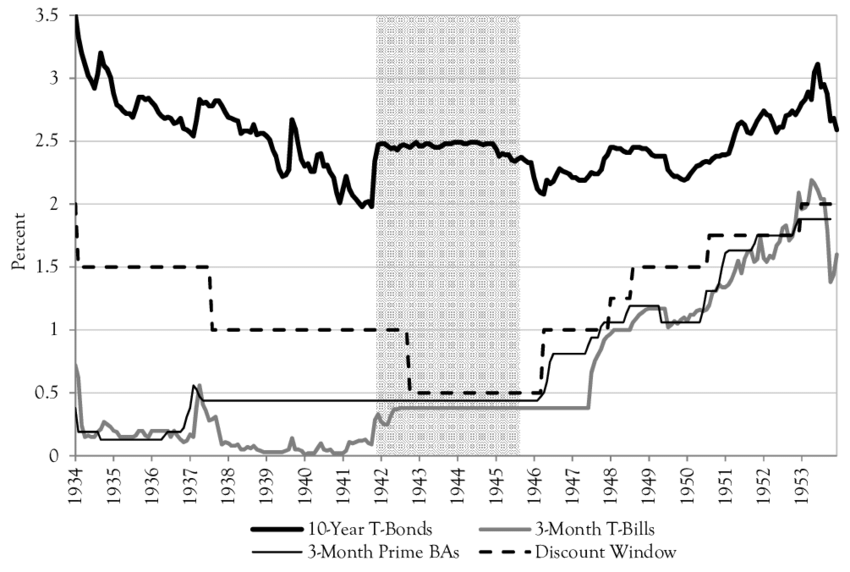
1942 - 1955, the government spent massive sums of money which created both an inflationary decade, a growth decade and a secular bull market. The Fed did not tighten during this period either and let inflation run hot to “inflate away” the debt/gdp ratio. It basically devalued the debt over the next 30 years.
This time period most resembles 1942 - 1955 because the debt to GDP ratio is similarly high. I don’t believe that the U.S. Government and Fed would ever be openly honest about their intentions but it seems that much of this was planned and it’s going according to plan. A big part of me tends to lean toward believing that debt levels got too high and they didn’t have a choice. They had to create inflation when they had the opportunity. It’s not a conspiracy theory if they have already done it once before, right?
Interest rates held artificially low despite inflation running hot best depicted by the 10 year and 3 month T-Bills.
This rationale is why I think the bottom is in on the S&P because now, the dollar must weaken and devalue from here to get rid of the government/public debt on real terms. On paper, the stock market’s earnings will go up in this event because economic GDP growth will be nominal (not inflation adjusted) rather than real (inflation adjusted). Essentially, earnings will be “inflated” with inflation.
The future, after all, is unknowable and all we can do is make the best educated guesses we can.
Till next time
Stay Tuned, Stay Classy
Dillon


Hi Dillon... Wow!!! Now your macro analysis 177 x 15 = 2,661.78 give the same target as mine for sp500. Well, I see a bit lower but more or less...
Good, well thought out analysis.
I just think, debt levels aside, rates need to go much higher to cool spending, thus cool inflation , because of a combination of solid consumer balance sheets and what is still a ton of lent up demand for things, pleasure and fun that people stopped spending on during the CIVID crisis, that spending is just getting started, IMO.
We shall see. The market will tell us, when it’s ready.