
Valuations - The Guide to Better Stock Picking
Valuations - The Guide to Better Stock Picking
Taking the next step in your stock picking strategy

Valuations are not objective, but subjective meaning it vary’s from business to business. There are many ways to value a business, all of which are forward looking at the future opportunity. Everything plays a role: earnings, sales, gross margin, balance sheet, operating margin, EBITDA, TAM, leadership, and competitive moat. However, there’s one quote by Howard Marks (Co-Founder and Co-Chairman at Oaktree) which has stuck with me for some time.


Or, better yet, another one of our favorite quotes from the Oracle of Omaha himself. “It’s far better to buy a wonderful company at a fair price than a fair company at a wonderful price” - Warren Buffet.
The importance of valuing a company is that it provides a guide for potential future risk/reward. Waiting to buy a good company with high profitability prospects for a good price can yield incredible long term investor returns.

The worst mistakes I have made directly had to do with over paying for a business or, selling a great business because “the valuation was too high”. The question then becomes, “how the hell do I know what to pay for a business?”
*Note* If you want to go directly toward valuation equations, scroll down to the bottom *End Note*
First, let’s briefly cover why stocks move. One must understand that a market is composed of millions (maybe even billions) of participants. We often think of “the market” as the stock market, but nearly everything within our economy is a market. Food, gas, housing, goods, vehicles, and even services have a supply and demand line.
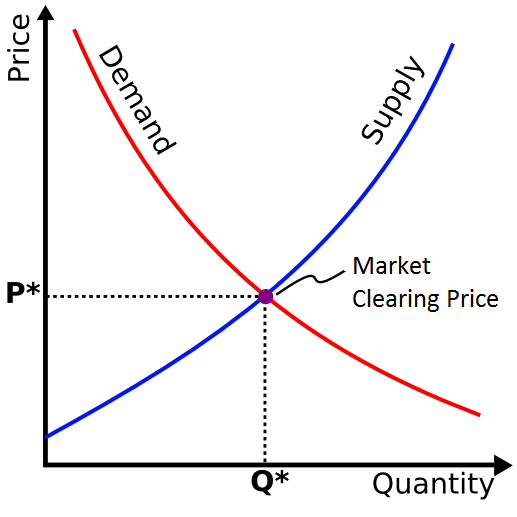
A stock price is nothing more than an equilibrium determined by the market. The goal of investing is the exploit the fluctuation’s in a stock price at periods when supply exceeds demand. Supply will exceed demand for two reasons:
Market forces - typically a correction or some fear driven macro event that has many different investors concerns about a nations macro economic future
Business fundamentals - When the underlying business in a stock does not perform well. For example: Bad press releases, bad earnings report, the loss of a major customer, etc.
If an investor finds a way to cut through noise, protect wealth, and take advantage of periods where fear, uncertainty and doubt (FUD) cripples the markets; returns can be great. Especially when they know and understand a particular business and know the current valuation of xyz business.
After periods of extreme volatility, the stock price always goes back to the intrinsic value of the underlying business fundamentals. We cannot control the broader macro environment but we can choose the stocks that participate in it. As investors, this is where the use of fundamental analysis comes in. Fundamental analysis can be defined as the research of the business model, leadership, financials and market opportunity. It can be further supplemented by understanding exactly what that intrinsic value of a business can/would be. In other words, the price you pay for the investment opportunity.
Market Cap Explained
The stock price is never the actual price of a given business. The market cap directly fluctuates with the stock price on a daily basis and this is the real value.
Market cap = shares outstanding x current share price
For example, company A currently has a $1m market-cap and only 10,000 shares outstanding (typically companies have a hundreds of millions, even billions, of shares outstanding but this is an example).
Company A:
$1,000,000 = 10,000 x (share price)
One can conclude that the share price is $100 using that equation. But, in this scenario, let’s say the share price goes up 20% to $120/share the next day. What would the market cap be?
Market cap = 10,000 x $120 = $1,200,000 or $1.2m
The market cap will go up by 20% in conjunction with the share price, which directly impacts the valuation of the business. In other words, if there’s a new IPO and the share price shoots up 30% on open. The market cap may not be available or updated when it first starts trading. What you can do is multiple the expected market cap the IPO was supposed to be and multiple it by the % rise in the stock price.
New IPO market cap = (expected market cap x (% increase/100)) + expected market cap
An example: let’s say company B is IPO’ing at $20/share with a valuation of $1B dollars. The share price shoots up 35% at open that means it is now $1.35B.
$1.35B = $1B + ($1b x (35/100))
$1.35B = $1B + $350m
$1.35B = $1.35B
How to Value a Business
It’s important to first say that this is NOT the only way to value a business. You can value it based on total assets over liabilities, discounted cash flow, or expected future earnings. Institutions run complex algo’s to help determine the price of any given stock. As retail investors, what we need are a few formula’s to help us understand exactly what we’re getting ourselves in to when assessing risk/reward. I typically run a few rough calculations to get an idea of what I’m paying for a stock.
Enterprise value can, at times, be a better measure of the overall business by attributing for total cash on hand and total debt. When I do EV, this means enterprise value. How you come up with it:
Enterprise value = market cap - (cash - current debt - longterm debt)
If a company has more cash, the enterprise value will be lower than the market cap. If the company has more debt than cash, the company will have a higher EV than market cap.
For this example, I will use SentinelOne $S to explain why I don’t understand the stock despite it being a good business.
First step is to always understand roughly, what a P/S of a business may be.
With it being September, I try to estimate roughly what the full year revenue will be. From there I take market cap divided by full year 21’ revenue.
Equation: Market cap / FY21 revenue = Price to Sales ratio
SentinelOne Equation: Assuming a $16B market cap
$16B / $190m = 84x P/S
This is extremely high and nearly in bubble territory. Most businesses, SaaS especially, trade at a 25x - 35x P/S when they’re in hyper growth mode. But, to draw comparison, D-Local is another stock I own that’s similar to this type of growth and is trading at a crazy 50x P/S for FY2022 and 68x P/S for 2021. I don’t think D-Local is overvalued, but that has a lot to do with estimating exactly how profitable this revenue is. We’ll come back to this.
Next step is to value what the current gross margin’s are to assess the profitability potential.
There are a lot of businesses that run extremely high gross margins but don’t have earnings. This has a lot to do with how an income statement is constructed and how a business may be investing into future growth. But, in SentinelOne’s case, I would be more likely to see what the EV/S is and EV/GP, or Enterprise Value to Gross Profit, due to it being in hyper growth mode.
Equation: EV/S = Enterprise value / 2021 revenue
SentinelOne equation: $15.4B / $190m = 81x P/S
Equation: EV/GP = Enterprise value / 2021 gross profit
SentinelOne has a gross margin that fluctuates between 50% - 60% over the past few years. I will use 55% for the purpose of this equation. You can get gross profit by multiplying revenue by %.
2021 Gross Profit = $190m x .55 = $104m
EV/GP = $15.4B / $104m = 148x
SentinelOne has a -160% (or more) operating margin this year. There would be no reason to run EV/EBITDA or assess any other profitability metric other than Gross Profit. It’s losing money like crazy and it’s very expensive.
When I value SentinelOne, I genuinely struggle to think about purchasing this stock. I do believe it’s valued the way it is because of its leading technology in the cyber security space. It directly competes with CrowdStrike, who is a monster and is richly valued as-well, and even in some use cases beats them. That means SentinelOne is investing every last dollar it can obtain in the hope it can continue to compete with CrowdStrike and Microsoft. So far, it has been working but the execution risk is extremely high. If it stutters in anyway, we could see a massive multiple contraction. Also, another very large risk is running the “Snowflake Effect”.
Snowflake IPO’d last year, in 2020, at an insane valuation and has nearly traded sideways for an entire year. This is often a common theme for high priced stocks. The problem is that the execution risk is extremely high. One disappointing quarter will send the stock price tumbling down.
It does beg the question, why is it valued this way? Remember when I mentioned above that stock prices are based on future expectations. Stock prices are subjective, not objective and the primary reason why SentinelOne is priced this was is that it’s priced for 3-5 years of flawless execution and to obtain significant marketshare. They do have a leading tech and strongly compete (even beating) with CrowdStrike. Another reason is the Cyber Security market is not a nice to have in business, it’s a need to have. Many security stocks are priced with the anticipation that many of these businesses will continue to see revenue and earnings beats on even their own guidance.
The expected future earnings drive share price today.
The Expectations of Future Profitability
Going back to D-Local, where I mentioned that it’s not overvalued even at a P/S this year of 68x and 50x next year. This has everything to do with the quality of the revenue and profitability of D-Local. They are growing 140% - 160% this year (faster than SentinelOne) but they have 55% - 65% gross margins. More importantly, they have 40%+ EBITDA margins!
EBITDA = Earnings before interest, taxes, depreciation and amortization
In addition to 40%+ EBITDA margins, they have a very healthy net income of 30-35%. What this means is that every dollar they make is very profitable and high margin, which justify’s a high valuation with rapid growth.
EV/EBITDA ratio is what I’d most likely use to value this business and I run the financial metrics 3-5 years in the future. The reason why I do this is that, because this business is profitable and growing very fast you have to project what the future valuation will look like.
*Note* All businesses are run on financial projections, that’s why a business with declining sales has a bargain P/E of, let’s say, 10 and high growth businesses have P/E multiples higher *End note*
D-Local operates globally and processes commerce payment with a rapidly expanding TAM. 3 year revenue projection and EBITDA @ 40%, I assume they can continue to grow 100%+ YoY for the next 3 years but will lower revenue projections year by year to 90% and 80% respectively.
Projections:
FY 2021: Rev - $237M, EBITDA @ 40% - $94.8M
FY 2022: Rev - $450M, EBITDA @ 40% - $180m
FY 2023: Rev - $810m, EBITDA @ 40% - $324m
The current enterprise value is roughly $18B today, by using EV/EBITDA the equation is fairly simple:
Enterprise Value / EBITDA = EV/EBITDA
Using forward projections from today’s enterprise value for DLO:
FY 2021: 190x EV/EBITDA
FY 2022: 100x EV/EBITDA
FY 2023: 55x EV/EBITDA
One can quickly draw a conclusion that when pricing DLO accordingly from future expected earnings, it is not over valued. Don’t get sucked into the trap thinking that profitable businesses must only be valued 1 year out, you’ll miss many opportunities. The market values business 3-5 years out. The only time I don’t value a business 3-5 years out is when I’m using P/S because that’s more speculative in nature.
A very similar model can be ran with P/E, and forward P/E especially in mature businesses. When analyzing younger growth companies it’s best to use the following valuation metrics:
Enterprise Value to Sales: EV/S
Price to Sales: P/S
Enterprise Value to Gross Profit: EV/GP
Enterprise Value to EBITDA: EV/EBITDA
Not all revenue is made the same. If a company has exponential sales growth but terrible, unprofitable, margins chances are likely the market will assign a very low multiple. Typically you see high gross margin SaaS companies with the highest P/S ratio’s but it’s very clear that many of them are only in the beginning of their exponential growth curve. They typically want to take all their cash and invest it back into the business to capture as much market share as possible, as fast as possible, to grow business exponentially.
If a business is growing quickly, with high margins (gross/operating/EBITDA), and a large TAM it will likely be assigned a very high multiple. If a business operates in a competitive field, with low margins and a limited TAM, it will likely be assigned a low valuation. Your job as the investor is to identify and distinguish opportunities, and pick stocks, to yield market beating returns on your investments.
Summary of Equations:
P/S = Price to Sales ratio = Market Cap / total years sales (best used 1-2 years out)
EV = Enterprise Value = Market Cap - (cash - short term debt - long term debt)
EV/S = Enterprise Value to Sales ratio = EV / Sales
GP = Gross Profit = Sales x GP %
EV/GP = Enterprise Value to Gross Profit = EV / GP
EBITDA = Earnings before interest, taxes, depreciation and amortization
This is a way to measure profitability of a businesses operations and often excludes stock based compensation
EV/EBITDA = Enterprise Value to EBITDA
P/E = Price to earnings ratio = Market cap / earnings
Forward P/E = price to earnings over the next twelve months (NTM) = Current Market Cap / NTM Earnings
Summary of Context in Publication:
The best way to value small/mid cap businesses is by using P/S, EV/S or GP/S. This is due to high re-investment back into the business which typically yields negative earnings and EBITDA, especially when a business is growing 50% - 100%+ YoY. As a business becomes more mature, earnings are substantially more important. Typically you will use P/E or Forward P/E to value a mature company. Once a business becomes profitable, it’s suggested using metrics like EV/EBITDA to determine future profitability. The market prices stocks out 3-5 years in advance with various different financial projections, try to do the same when running valuations on your stocks.
Bonus - Rule of 40:
When valuing software companies it’s an unwritten rule to use the “rule of 40”. This is very helpful to assess whether a SaaS business is on an acceptable trajectory if growth + EBITDA margin % is greater than or equal to 40. This typically yields above average returns if found at a good price.
Growth % + EBITDA margin % >= 40
Next to Come:
I plan on releasing multiple pieces of content this week, following this will be a free publication on Palantir to share on Twitter. In addition, I plan on doing two YouTube videos within the next day or two. You know what that means guys!
Stay Tuned, Stay Classy…
Dillon
This is very useful for beginners like me to understand how to evaluate growth stocks. I really like the transparency in sharing this. If possible you please share some knowledge on how to really screen stocks and how to get these numbers from websites and tools.