


This SubStack has evolved over time and I discuss many different topics. What I have come to realize is that, although not always right, my mission is always the same.
I am dedicated to being a change in people’s financial futures through teaching the core principles of investing
Millennials Live Paycheck to Paycheck
Based on this latest article (above) from Bloomberg, nearly half of Millennials live paycheck to paycheck. When we break this down even further, only 30% of millennials say they are taking steps towards saving for retirement. This is an extremely small percentage of Americans between 25 - 40.
When we factor in the biggest problem of all, how we are able to save money, we can really pinpoint exactly how difficult this has become for an entire generation. The average American is solely dependent on 401k’s to get by later in life because we can forget traditional ways of saving for retirement. Generations before us had low risk options like bond investing, savings accounts with a decent yield, or pensions from your employer. All of these methods have all but vanished.
This brings me to the point of this publication. Because I am dedicated to teaching the principles of investing, I am much more inclined to teach a man how to fish rather than giving people a fish. Many different investment services have a, “follow along with my portfolio” approach. This rarely works for the individual investor who is dependent on someone else’s moves. What really works is by passing knowledge down that enables the investor to take control of their own destiny.
If I do my work correctly, many subscribers will not have have to stay subscribed to this SubStack, over time. I believe the lessons learned in this one will have the sort of impact. I am going to talk about:
Stock picking
Analyzing a business successfully
What to look for in business financial statements
What a good investment looks like, and
Where to find all this information for free.
What You Need to Know About Investing in the Stock Market
This should go without saying but the amount of noise and complication that comes while participating in the financial markets is very loud. I believe this noise all comes in good faith because it’s meant to “manage risk” to mitigate any sort of down turn in an individuals portfolio. However, investors must understand that this typically is manufactured by Wall Street because the business they are in is different than the business we, as investors, are in.
Wall Street money managers focus on quarters, metrics, returns and goals over a short time horizon. People give Wall Street (hedge funds, banks, institutions) money with the expectation that they are going to get a desired yield. In almost all cases, this yield is measured in quarters or years. This means that they can’t necessarily focus just on a business over a long period of time, their focus must be on multiple different asset classes to generate a return.
Let’s simplify exactly what the stock market is. It is a market of business equity, or stock. That means that each one of these ticker symbols represents a business. When the price goes up, or down, it is only fluctuating on the perceived value, or supply and demand, of the equity. In many cases, this perceived value quickly fluctuates and the price fluctuates. The factors that, in the short term, manipulate the value of the stock include:
Economic headwinds or tailwinds
Interest rate fluctuations
Perceived competition
News headlines
Insiders buying or selling
Basically, the supply and demand of business equity will often fluctuate with no reason/rationale that’s directly tied with the business. Let that sink in, people will buy and sell business equity with no understanding of the business or changes in the business. Market participants will often buy business equity just because they think it’s going up and will often sell just because it’s going down.
I bring up this simplification and rationale to really put things into context. We, as investors, must genuinely digest that fundamental understanding. People will buy and sell business equity with no real rationale on the underlying business performance. Over looking this key, and very important detail, is exactly why so many people lose money in the markets or quit. COUNTLESS times I have seen investors quit investing because they simply think things will just keep going down. But this begets a crucial question, “what changed with the business?”
What you need to know about investing in the markets is that the noise is extremely loud and the business you are investing in doesn’t need to do anything for its stock price to move down. But, when it comes to sustainable moves upward for stock, it universally has one reason why it does this. The business is fundamentally improving its revenue, earnings, and cash position.
I have to repeat that point one more time; stock price sustainably goes up because the underlying business improved its revenue, earnings and cash position. That means that in order to generate real, long term, returns, investors should buy equity in good businesses at good prices. It’s that simple. Honestly, it is that simple. Buy good companies, at good prices, then let the company grow over time.
Evaluating a Business - Is It a Good or Bad Investment?
Our daily lives are often linked to businesses with stock that’s being traded in the financial markets. For example, I am writing this SubStack on an Apple computer. SubStack is still a private company but Apple is publicly traded. You may have been linked to this SubStack through Twitter, a publicly traded company, where I have grown a bulk of my audience.
Despite using all these products and services, it does not always mean that their business is going to be good to invest in. There are many different factors that will determine what good is and what bad is but the most important of which is how effective the business is at generating cash and earnings over the long term. Think of this is as a puzzle. We know what the puzzle is supposed to look like but there are a lot of pieces we need to put together. The primary factors that determine a company’s long term success include:
The market which they operate in
Competition and leadership positions in their given market
Financial statements like the income statement, balance sheet and cash flow statement
The business model and how effective it is at retaining/growing clients and generating cash
The demand for their product or service
The job of the investor is to put a mental checklist together to understand the total picture to make a judgement. To further explain, I am going to show you my process on how I analyzed one of my favorite business, Global-E, and explain what I am looking for and where I find the information.
Global-E ($GLBE) Example
When I first discovered Global-E, it caught my attention like many of my other investments. I noticed the financial metrics were very appealing and they were growing very quick, profitably. If a company is growing revenue effectively, this is almost always a justification for investing my time to discover and understand the business more.
The Businesses Model
When first discovering and understanding the business model, the best place to look is not always going to be other investor write ups but simply the company’s website. The reason why I choose not to read other investors write ups on individual businesses has to do with their potential bias. An investor may publish an article and only see what they want to see, overlooking the potential risks and uncertainties. Basically, I look at it like a sales presentation.

When first looking at a company’s website, you must first ask yourself a few key questions:
What are they trying to sell?
How do they help their customers?
Basically, you are attempting to put together a story of who they are and what they do. A common mistake I see with most investors is that this is typically the furthest they will go in their analysis. A majority of research will be spent understanding their business model to such an in-depth level that it will often be over looked at what really matters; revenue, earnings and cash flow.
In Global-E’s situation, you can get a pretty good picture of what they do when you look through their website. Essentially, they enable cross boarder e-commerce transactions. A good question to ask once you understand what their good/service is, “how do they help their customers”?

The absolute BEST place for investors to look is going to be the investor relations tab on the company’s website. This is where we can find very important resources like:
Investor presentations - Basically a power point of what the company does
Investor conference calls
Investor day presentations
Earnings reports
Press releases
Company financials
To discover more about what the business does and how they help their clients, one of the best areas you can look is the “events” tab under investors relations.

In Global-E’s situation you can see that they have a few upcoming calls in May and June. However, there are always archived (past) presentations that are equally important. The format of these calls with Needham, Oppenheimer, JPMorgan, or Morgan Stanley is similar to a fireside chat, Q&A, session. These questions are extremely helpful in getting a wholistic picture in what the business does, how they help their customers and what they are trying to become long term.
I have found that understanding where the business is going long term is equally as important as understanding what they do today. The market is not dumb, it is forward looking. Try to look at what a business is, who they are becoming and who they want to become.
Understanding the Market and the Opportunity and Competition
Once you get an understanding of who this business is and what they do, investors should immediately seek to understand the market they operate in, the markets growth and their top competitors. In many cases, this type of research is best done through 3rd party resources. I have consistently found that company’s over exaggerate the market opportunity and their position in the market. 3rd party’s don’t lie. A good place to get started is a simple google search.

In this case you can see there are a few sources where you can see the market research. For today, I will choose Statista’s website. Below, you can see that they outlaid an easy to understand graph that shows its projected growth. If you can find markets that are growing >15% CAGR (compound annual growth rate) this is extremely helpful for the businesses that operate in it.

I cannot under estimate the importance of a growing market opportunity. This leaves room for error (for the business) and creates a tailwind at the back of many investment. If the market opportunity CAGR is less than 15%, the business must be demonstrating that it is clearly taking market share. However, from an investor standpoint I have found that the best stocks are located in secular market opportunities because it is a new, emerging, market and opportunity.
Usually in these younger markets, competition is not as solidified and the participants are all competing for the top spot and market leadership position. This is where I try to find a majority of my investments. In Global-E’s case, this is a perfect example. Let me briefly explain.
Global-E enables cross boarder e-commerce which helps clients navigate:
Legal complexities
Payments
Distribution/Shipping
Local geographic capabilities, etc.
Just think of the complexities of cross boarder commerce and this is where they help. Because of their core competencies, they operate in the global e-commerce market. On a business model basis, where they exclusively do cross boarder e-commerce, they stand alone in this category. There really is no significant “direct” competition but there is such a thing as “indirect” competition. For example:
BigCommerce has cross boarder functionality
Shopify (who owns 10% stake in Global-E) has a similar solution for smaller clients
DLocal, another one of my investments, handles the payment processing portion of cross boarder commerce. Nuvei, Adyen, and Stripe all do something similar in more developed countries. Global-E has a payment solution and services.
MercadoLibre essentially dominates Latin America’s e-commerce market
Sea Limited dominates south east Asia
Amazon dominates much of the west
The thinking here from an investor standpoint is that, although there may be no “real” direct competition, indirect competition is just as relevant. Another example I can think of here, that I believe teaches all investors the importance of indirect competition, is Peloton.
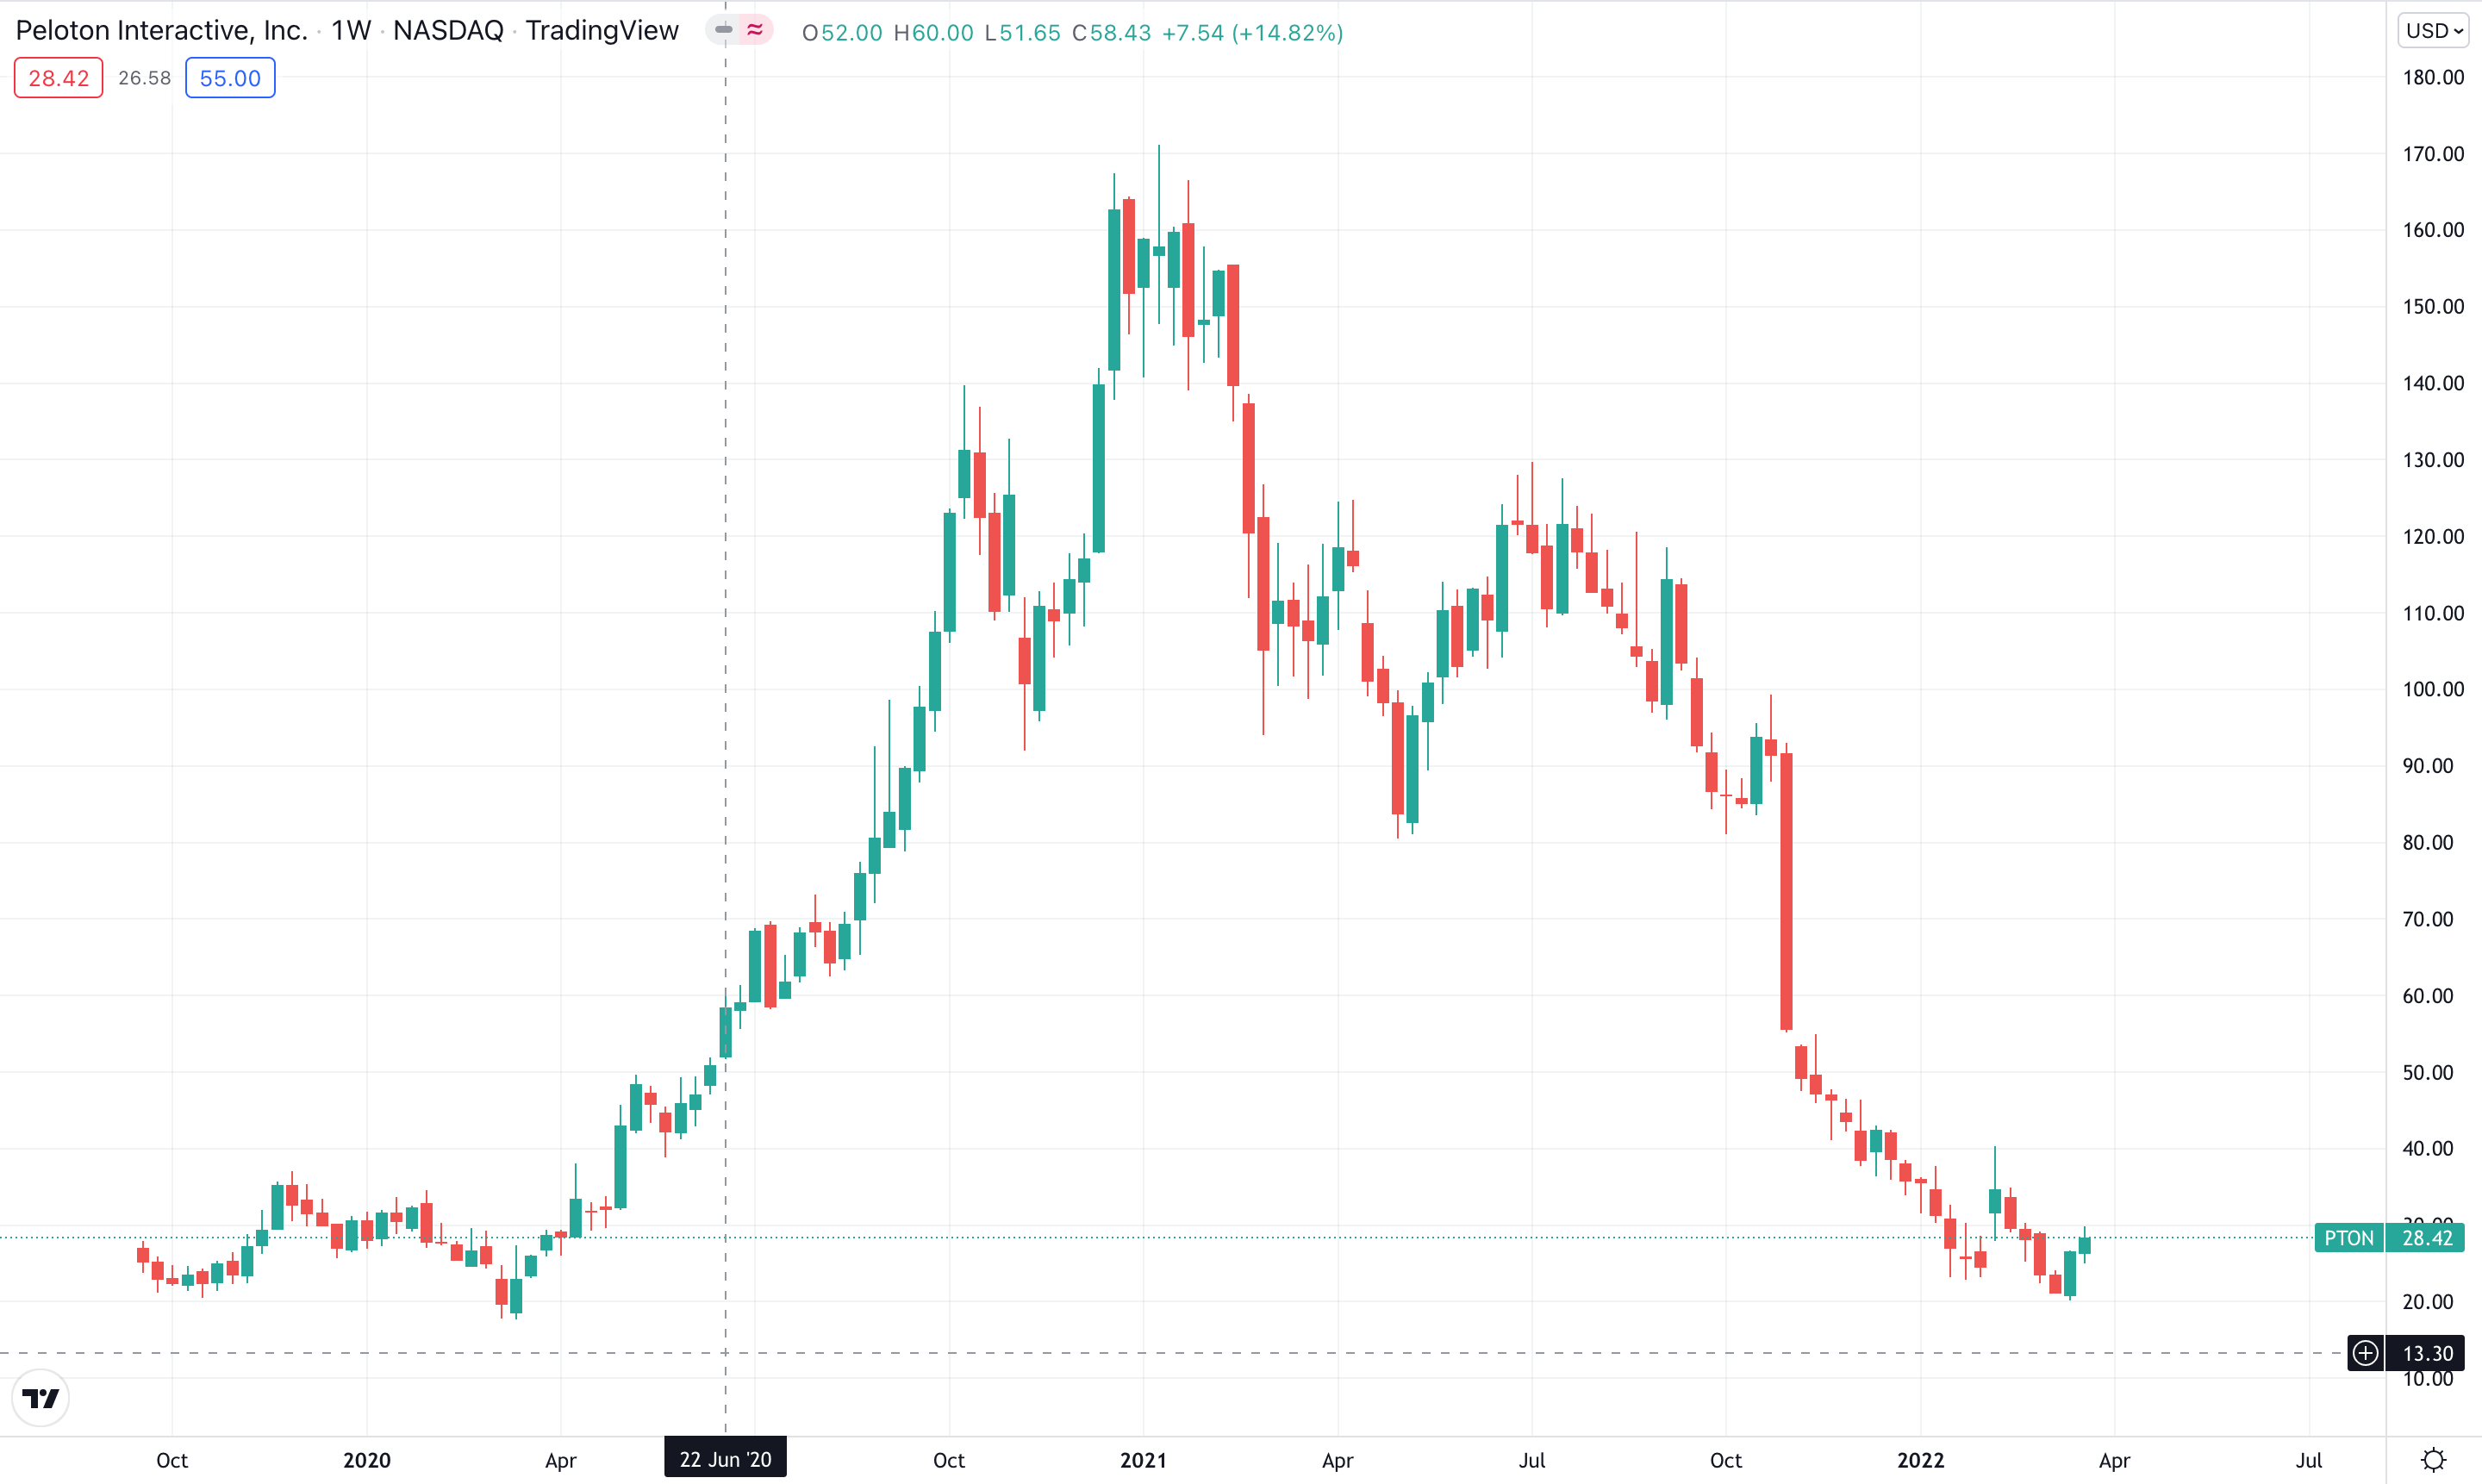
Peloton sells at home workout equipment. Their core product is a Bike with a television attached to it. They would hire their own trainers and have their own workout classes. You could imagine that this was a major beneficiary during the COVID-19 pandemic because gyms were closed down.
The indirect competitor in this case are all gyms like LA Fitness, Lifetime Fitness, Snap Fitness, etc. All of their indirect competition was closed for the better part of 2020. As a result, Peloton’s stock surged and their sales surged.
During 2021, Peloton’s stock collapsed and the story unraveled. Many retail investors got hurt because they failed to understand how important indirect competition is to a long term business thesis. To really simplify this point, competition both direct and indirect can destroy a business. Do your absolute best to find the market leaders of a growing market. The odds become substantially in your favor.
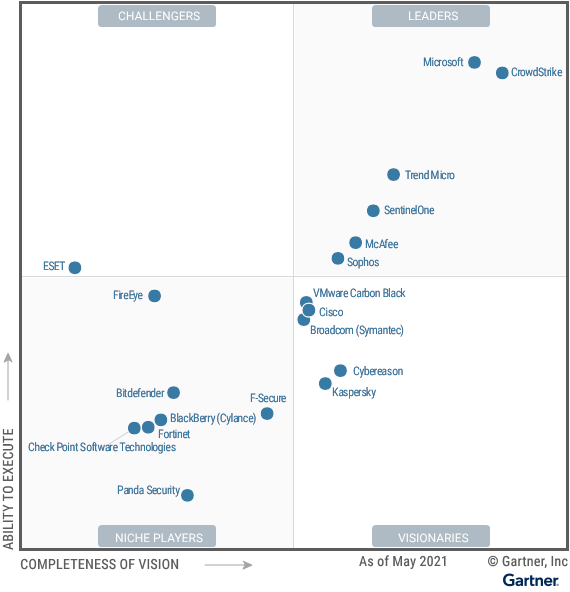
If you’re interested in investing into Software Stocks, Gartner usually provides a really compelling market analysis. Above, I provided an example of the endpoint security market with SentinelOne and CrowdStrike. This market analysis by Gartner is called the “Magic Quadrant”. Investors should know that all investing decisions can’t be made only with those in the leader quadrant. This is more of a useful tool to understand the market more than it is used for investing decisions. The best way for investors to read this:
Niche players usually don’t present the best opportunity
Challengers usually have a strong business and operating model, this is the execution quadrant
Visionaries usually have substantial product innovations and could be leading from a technological perspective
Leaders have the best of both categories, meaning they execute well and have good tech
Ideally, one would think that if you just picked stocks in the leader quadrant, it should turn out good, right? Not always because, remember, the only thing that gets a stock to go up intrinsically over time is when they grow revenue, cash flows and earnings. If a business is executing well with great technology, but they are not yielding any profits and don’t have a path to profitability, the stock will not move. There is no better example of this than Nutanix $NTNX:
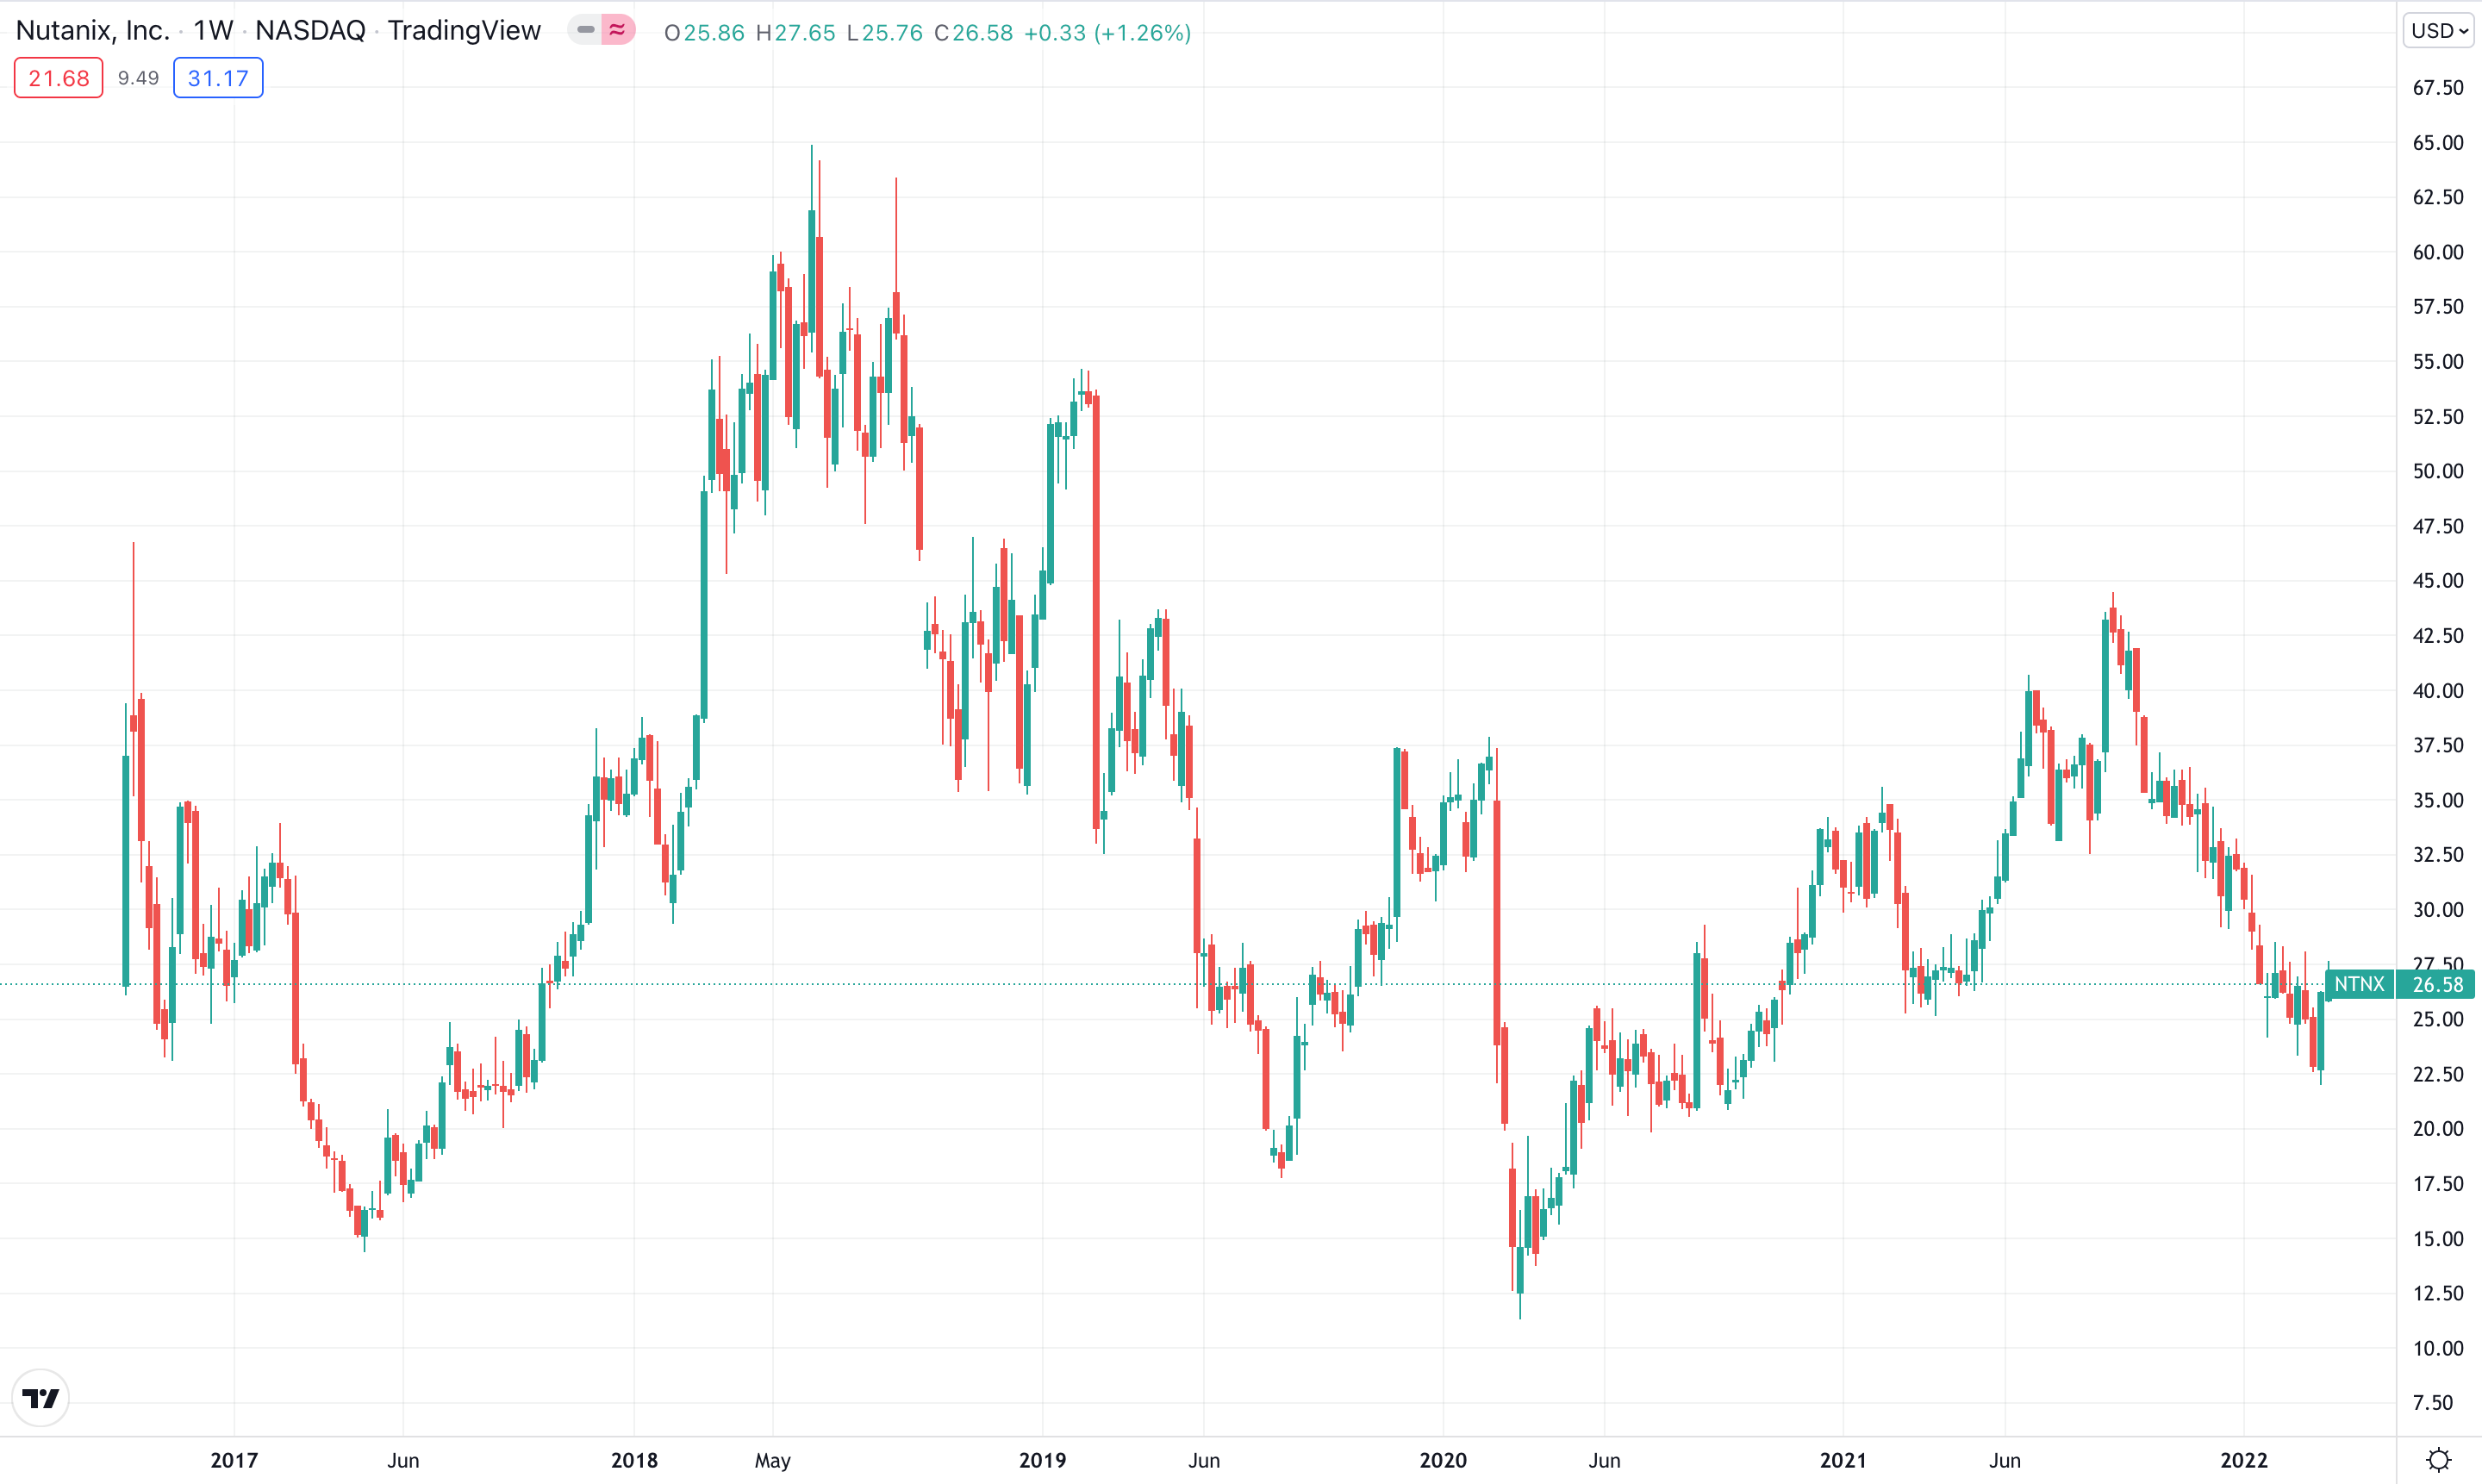
Reading Financial Statements to Bring the Story Full Circle
Understanding the business model is extremely helpful. Investors need to know what a business does, where the business is going and how they make money. In addition, knowing and understanding competition is equally important. But, none of this matters if the financials of a company is messy. Remember, the only reason a stock goes up and stays up is if it successfully grows revenue, earnings and cash flow over time. The best example of this is Crocs $CROX:
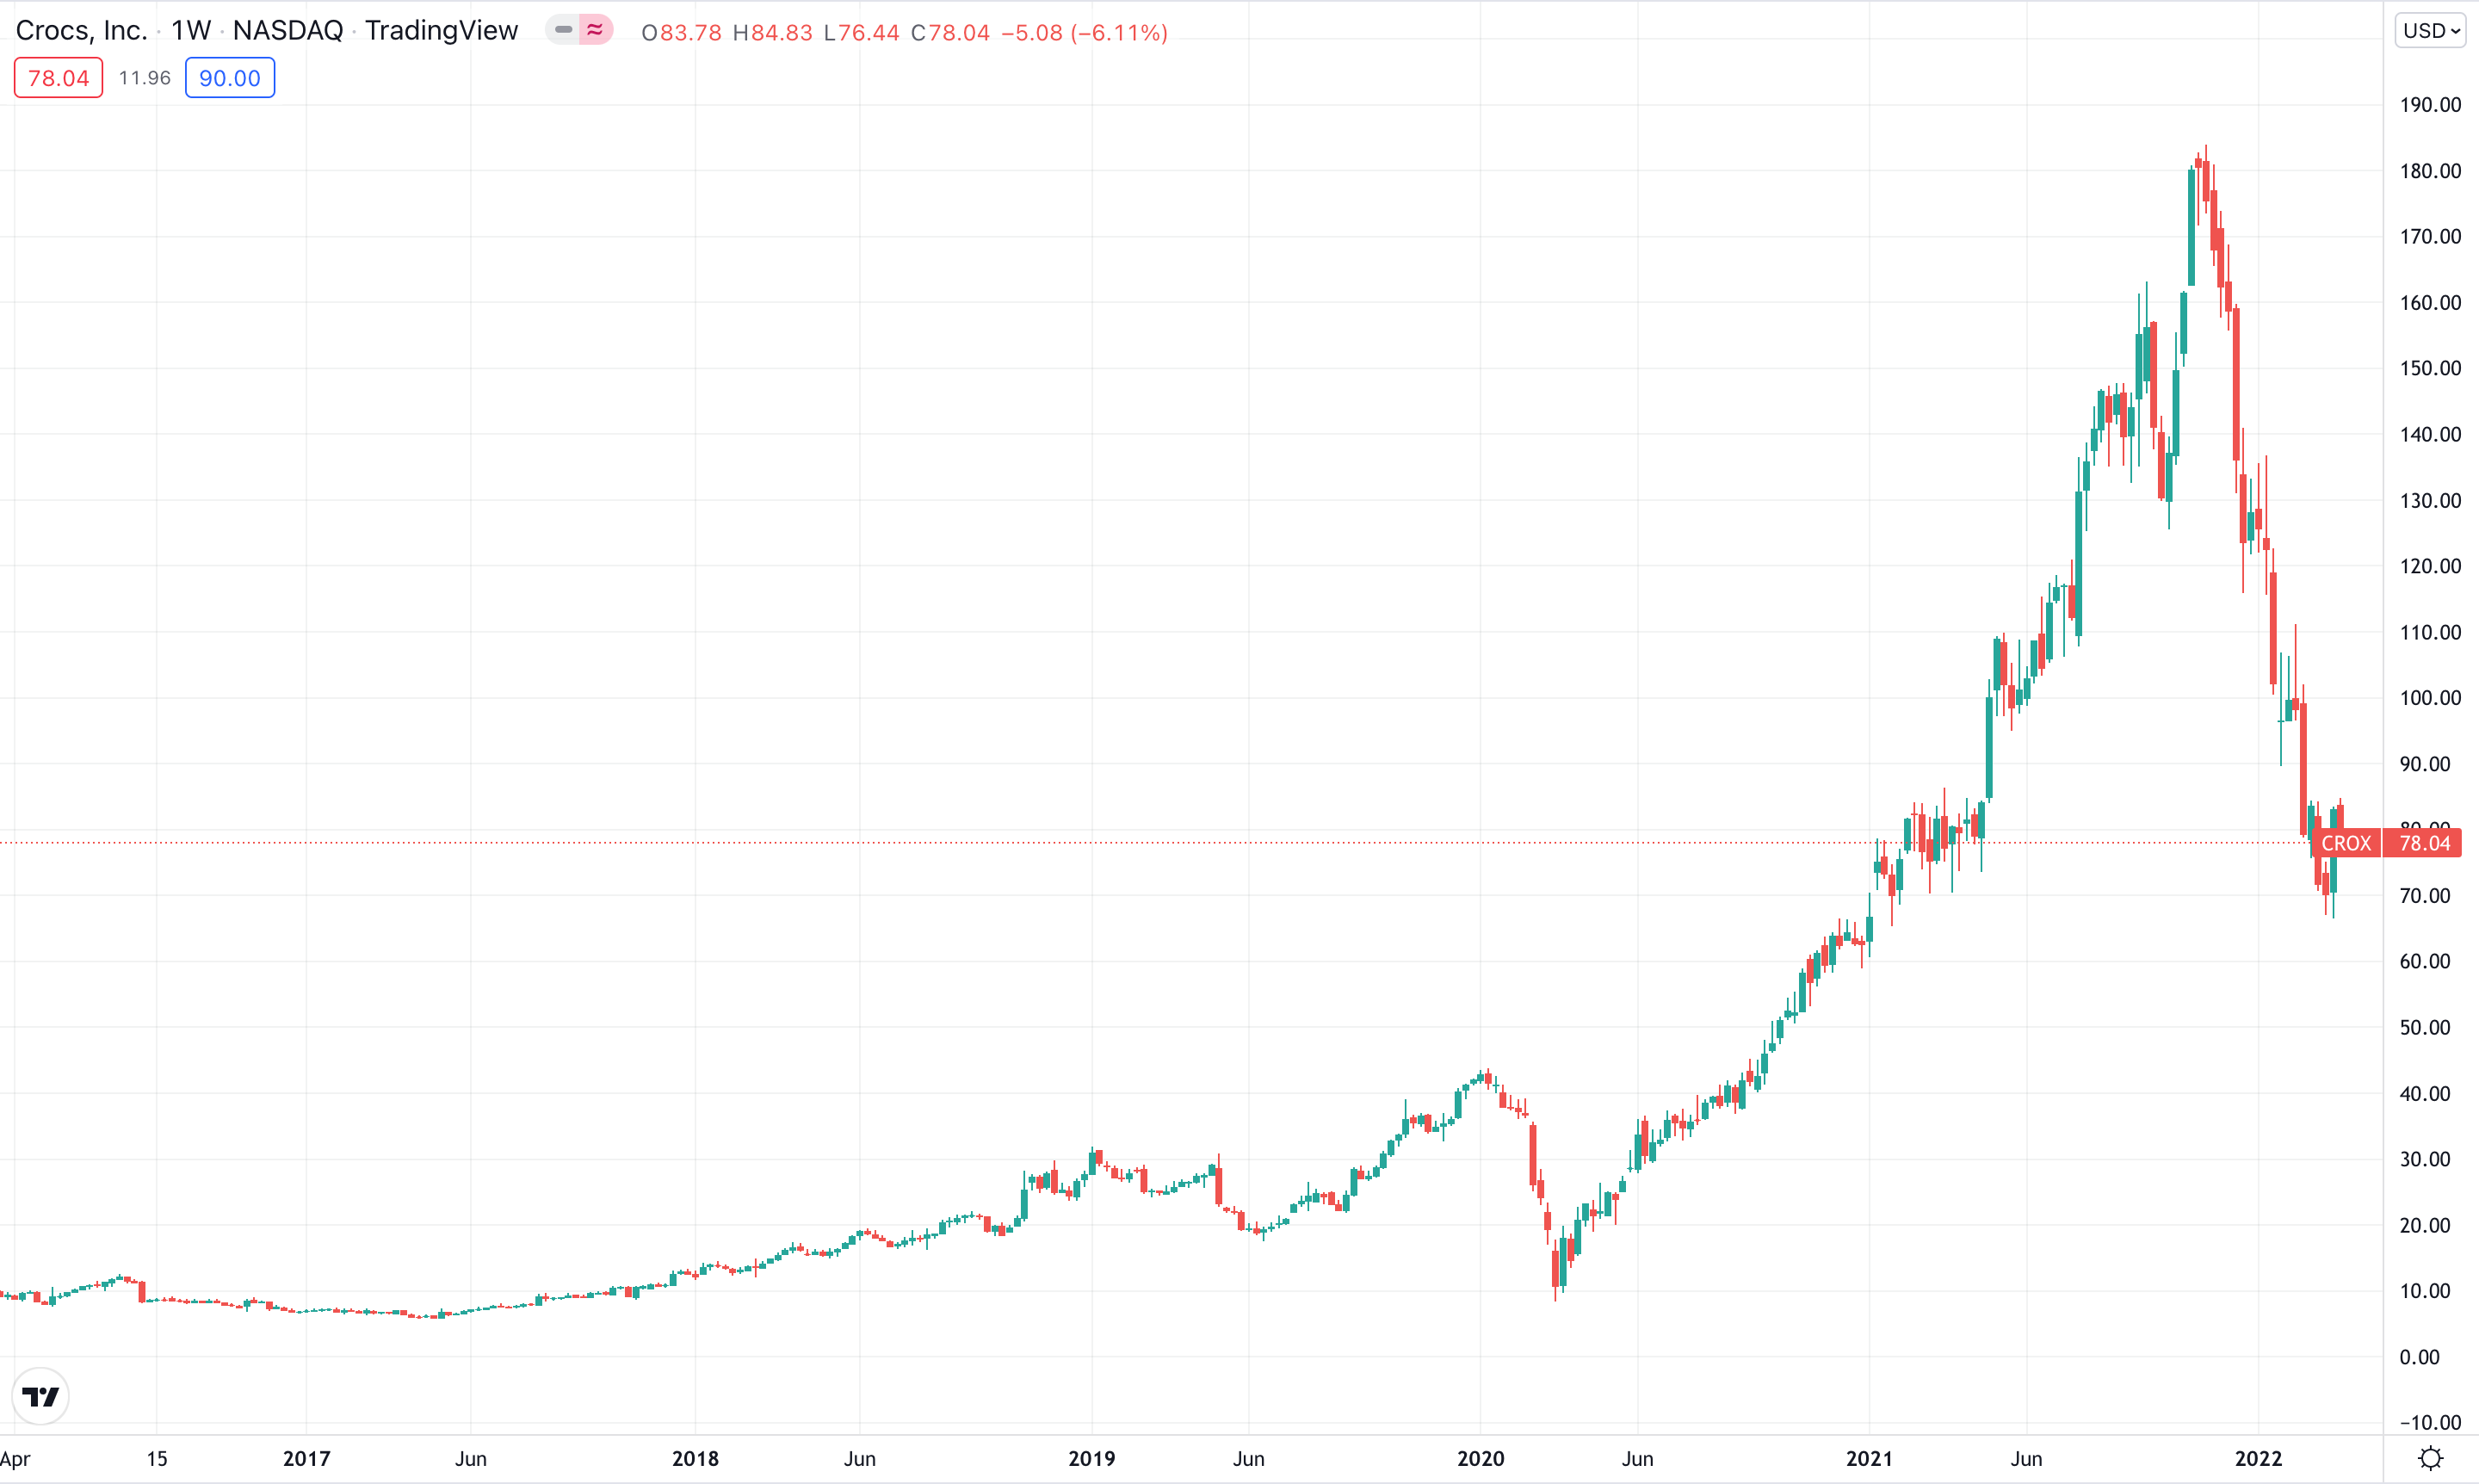
Above you can see Crocs stock chart that has appreciated rapidly over the past few years. The business model is the easiest thing in the world to understand, they sell “Crocs” (below) which are these type of sandal/shoe things. It’s not anything special, there is no super innovative technological break through, and they kind of look funny.

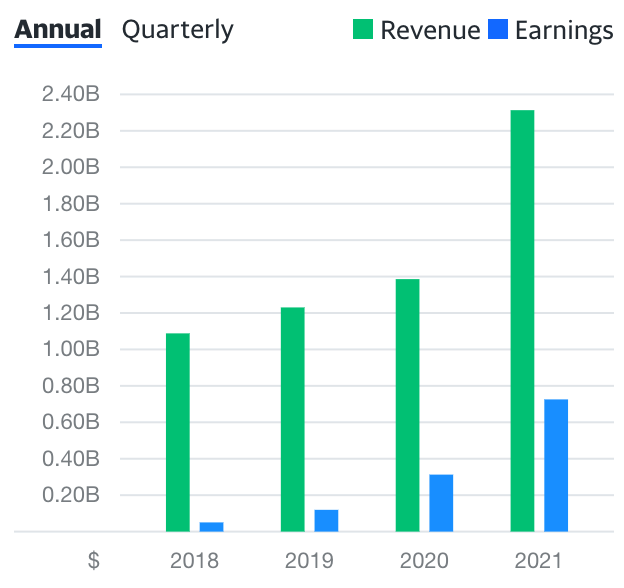
But, over the past few years they have successfully grew revenue and earnings. The picture below is from yahoo finance where the green bars represent revenue and the blue bars represent earnings.
Crocs Annual Financial Trends
Going back to analyzing Global-E, we understand that they do cross boarder e-commerce, which sounds like a pretty good idea. In addition, we know their competition is limited in a direct fashion but in an indirect fashion it may present some risks. We also know that their market opportunity, long term, is growing exponentially as global e-commerce becomes more relevant. At this point, we have a general thesis on our business.
As mentioned earlier, many investors stop at just developing the thesis and understanding the story. But, this is a fundamentally flawed framework. As investors, three financial reports make or break our entire investing thesis. They are:
The Income Statement
Balance Sheet
Cash Flow Statement
These statements shouldn’t necessarily be perceived as an end all be all, or an absolute to an investing framework. They should be used in conjunction with the thesis you have developed between the market opportunity and the understood business model. When looking at Global-E’s financials, I have often found that Yahoo Finance is a really good, free, platform to use.
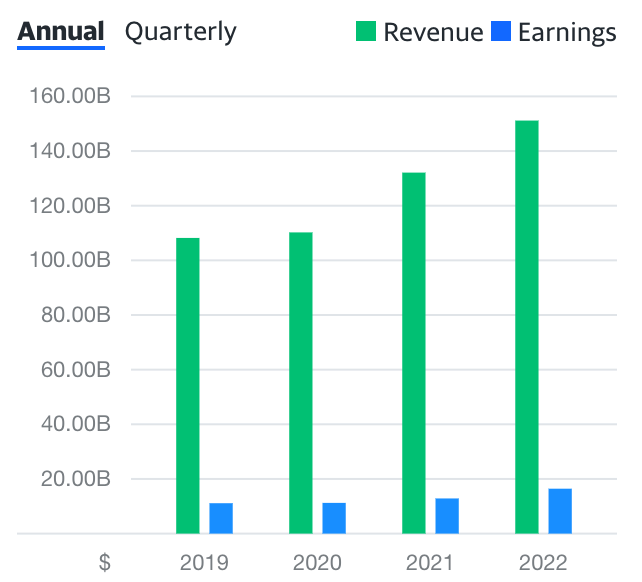
Global-E Annual Financial Trends
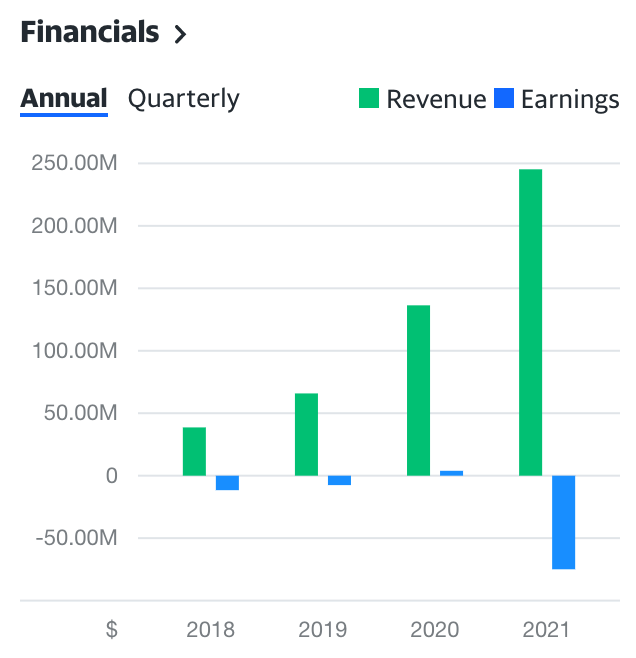
The first thing we should do is check the historical trends both annually and quarterly. I have made arguments that this may be the most important step in stock picking. The reason why it’s so important is that it tells you if the business is growing or declining. In addition, it tells you how consistently it’s growing. Ideally, we are seeking to find investments with growing revenue, even if it’s not as rapid as GLBE. A good example here is Home Depot, which is a mature dividend stock.
Home Depot Annual Financial Trends
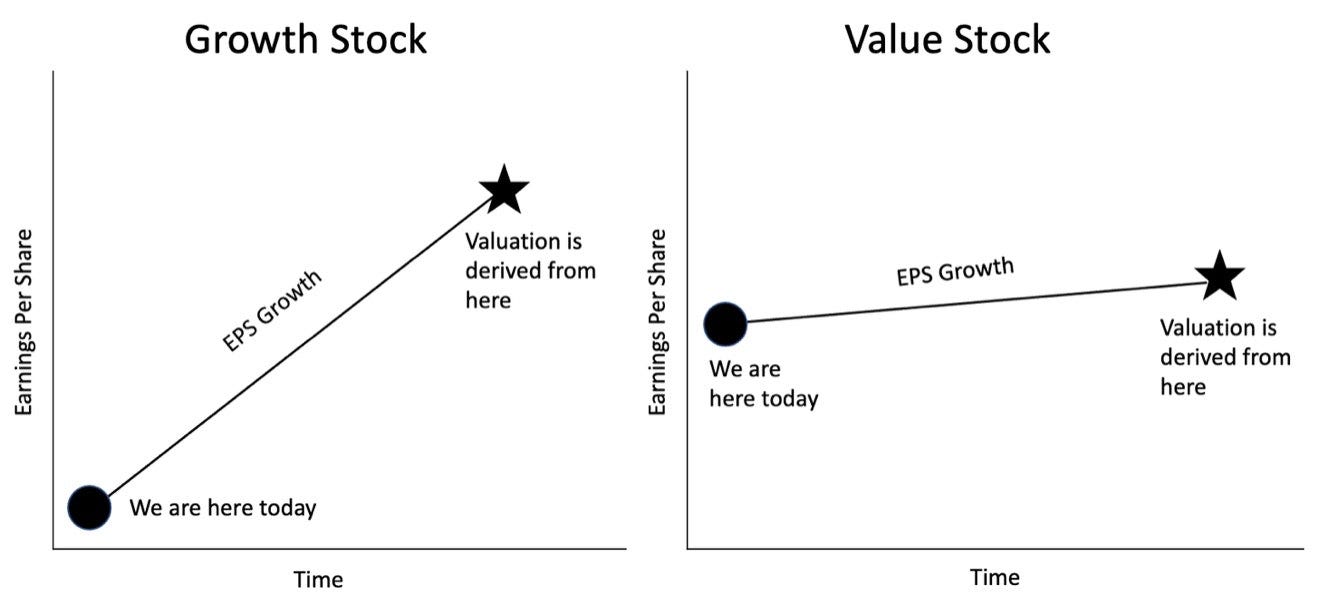
In both cases, it’s very important to recognize the general revenue growth. A growing business is a healthy business. Otherwise, you run a risk of catching the business on it’s decline and the back half of its life cycle. The image below perfectly describes this life cycle. In my strategy, I try to find businesses in the “Growth Stage”. However, I wouldn’t necessarily say my way is the best way but the principles are still the same. There is lower risk and lower volatility when it comes to investing in businesses in the maturity phase. In addition, mature businesses usually pay a dividend and decline substantially less during stock market crashes.

When you have a general picture of the revenue and earnings trends over the past 5 years, an investor must first understand that not all revenue is made the same. In many cases, investors have a difficult time separating the differences between stock valuations and why one stock may be at a higher price to sales ratio than another. The reason why; one stock has better bottom line financial metrics than the other.
Global-E Income Statement
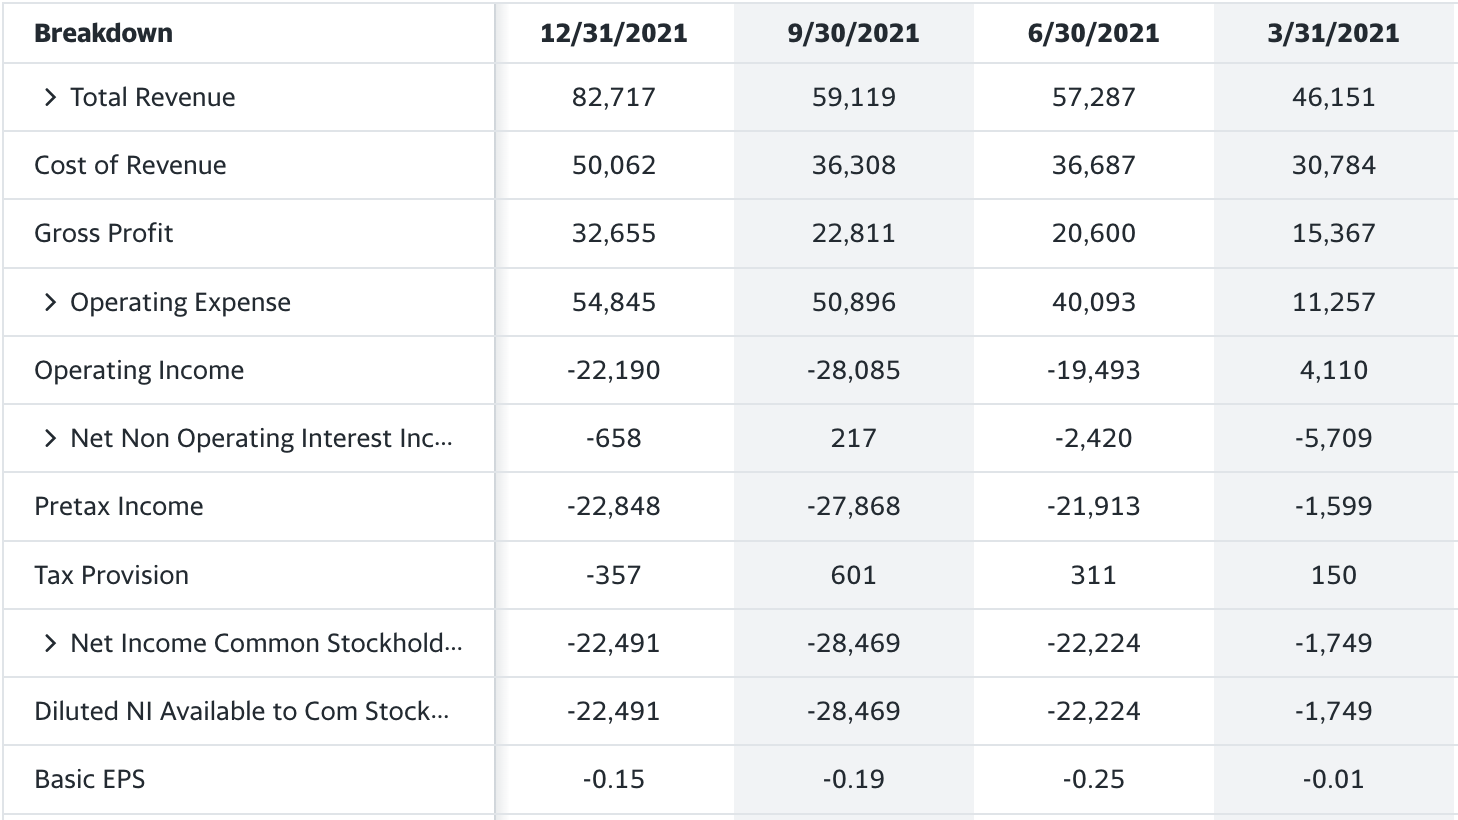
If you’re familiar with an income statement, the first thing you may notice is how it is operating unprofitably under GAAP (generally accepted accounting principles) metrics. But, we have to break this down a little more to look for exactly what we need to understand. A few questions to ask yourself:
What is the trend of revenue? Is it improving? Are there quarters where it fluctuates?
What is the gross profit? What is the trend of the gross profit margin?
What is the GAAP operating profit/loss? What’s the trend?
What is the margin on GAAP net income?
Remember, the reason why you are looking at the financial statement in the first place is to validate your original thesis on the business model and total market opportunity. If you get a good understanding of the market that it’s operating in and you know that the business has years of growth ahead of it, TONS of businesses may operate unprofitably. At least, under a GAAP basis they do. More on this when I cover the cash-flow statement.
In regards to Global-E, one of the first things I noticed was how their Gross Margins were improving really quick (improving with scale) while still maintaining it’s growth trajectory. The high growth trajectory circles back to my thesis of the growth “story”. I assume that international, cross boarder, e-commerce market will be on a growth trajectory for years. I believe this is a play on secular e-commerce trends in our world. Knowing what I know about the market and how it’s projected to grow, Global-E will operate within this market. The years up until this point, Global-E has demonstrated that it has an ability to grow within this market somewhere around a 90% CAGR (compound annual growth rate). This growth rate is extremely fast.
Global-E Income Statement
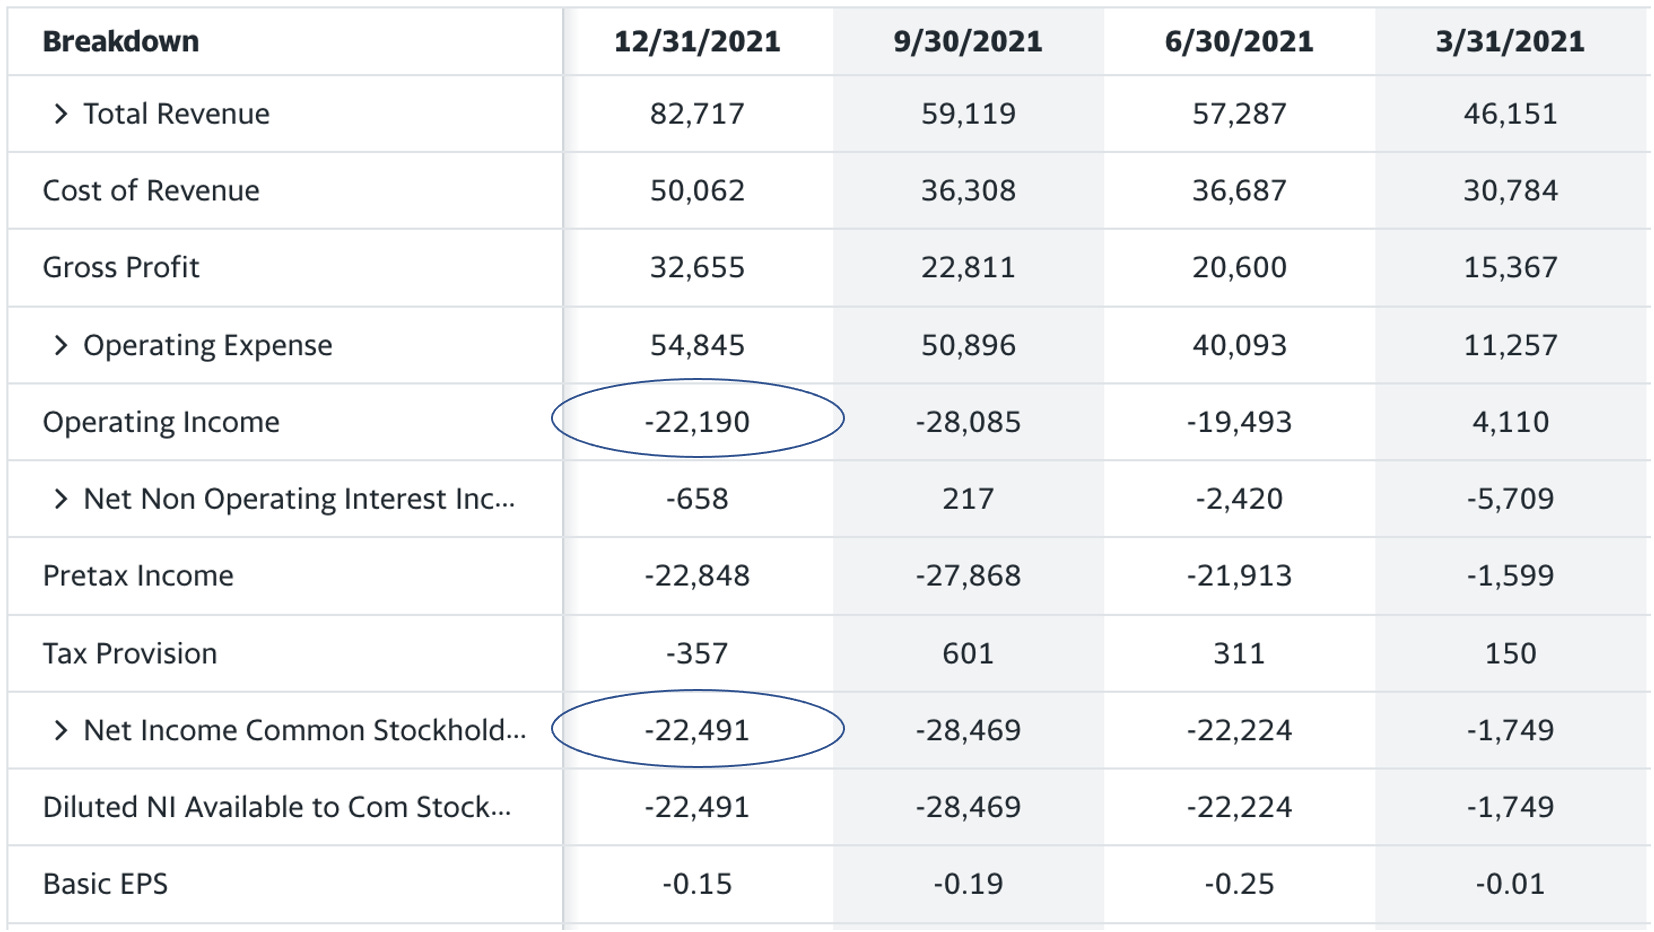
Despite this story showing an optimistic view, we have to go back to the number one principle of investing. Stocks only go up and stay up if they are growing revenue, cash flows and earnings. When you look at the income statement above, I circled two areas that show Global-E is operating unprofitably. The only thing this means in many cases is that the business is investing for growth. The next questions to ask yourself:
What is their cash position?
Are they losing cash?
Do they have enough cash to scale to their growth plans?
If they run out of cash, what is the likelihood they will need to dilute share holders?
When thinking of their cash position and cash flows of the business, this is a lot like the “health report” of the business. If a business is losing cash faster than it is taking it in, they MUST be close to, or trending toward, operating profitably. If they don’t, the stock will sink and investors are running the risk of losing their entire upfront investment over time. In regards to GLBE, what is their cash position?
Global-E Balance Sheet
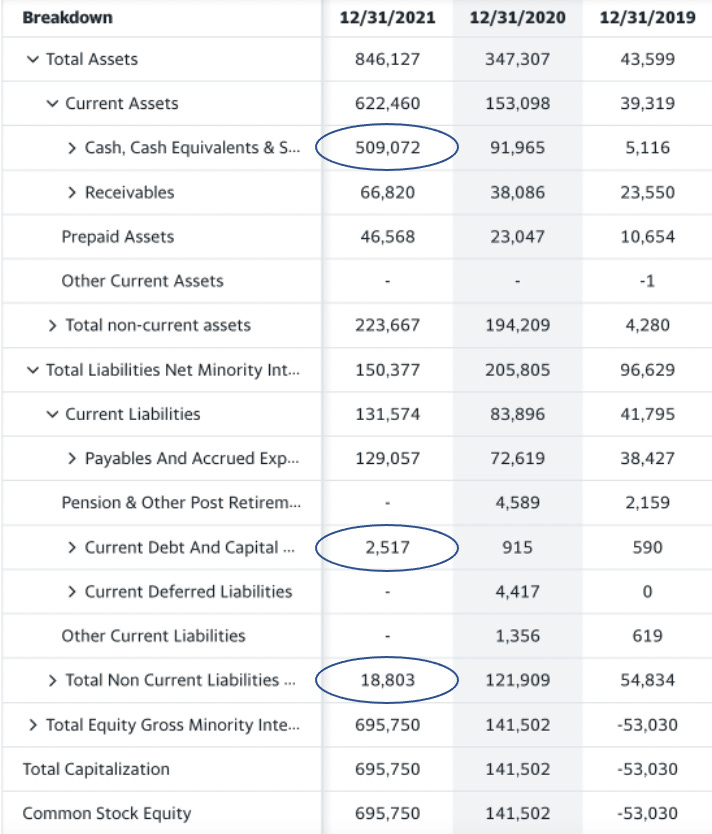
The Balance Sheet is arguably one of the most important financial statements to know and understand. If you ever have went to the Doctor before and they run a bunch of tests, take your vitals, etc and they come back saying, “everything looks good” or, “I am concerned about (xyz) levels”. The Balance Sheet acts a lot like that except it’s the internals of a business. For the sake of simplicity, I circled the three most important areas in the balance sheet.
On a side note, the entire sheet is important as assets should always exceed liabilities and the more “equity” a business has, the more valuable the share price usually is. If a business has negative equity, the stock price likely wont move, ever.
The circled areas represent the total cash balance, current debt and long term debt. If I were to make a comparison to personal finance this would look a lot like your checking/savings account (cash balance), credit card (current debt), and home/auto loan (long term debt). A rule of thumb between current and non-current assets can be thought of as liquid or illiquid assets (think stocks vs real estate). In regards to current and non-current debt, think about the time it needs to be paid back. Current debt needs to be paid back within 12 months and non-current debt is usually lower interest and doesn’t need to be paid back for a few years.
Global-E’s balance sheet reflects a $500m cash balance, $2.5m in current debt and $18m in long term debt. This is extremely easy to see that this is a healthy balance sheet because they could pay off all debt and still be sitting in a great position. This tells us, when we circle back to our original thesis developed about the “growth story” that they have a healthy amount of cash on hand to continue to funnel into the business.
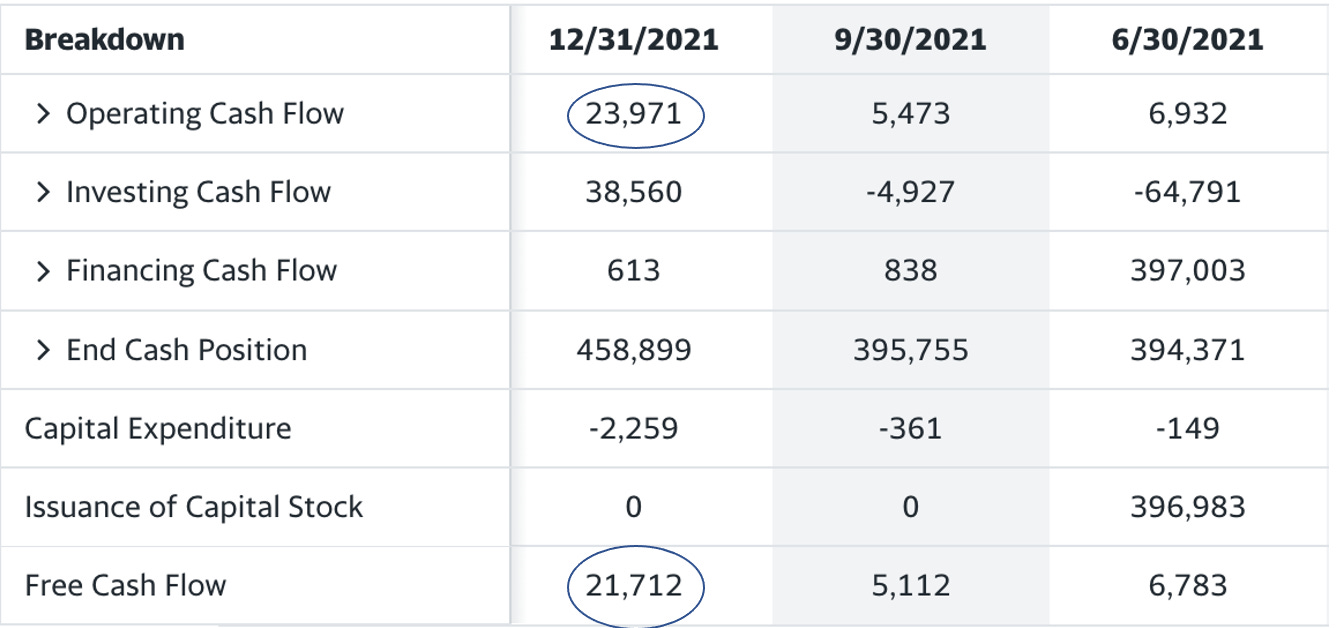
Global-E Cash Flow Statement
Next, I would argue is the most important part of this entire process and the most overlooked when looking into a company. We need to circle back to exactly what we know about Global-E at this point:
We know that they enable cross boarder e-commerce after looking at their website
Our market analysis led us to believe that this market (international e-commerce) is going to keep expanding for years and years into the future
We know competition is relatively low on a direct basis but on an indirect basis, there’s some competitive risk
After looking at the income statement, we know they are not operating profitably on a GAAP (Generally Accepted Accounting Principles) basis
We know that they have a healthy balance sheet with low/no debt and a solid cash balance
The only thing we need to understand is how much cash is the business bringing in or spending? This is arguably the most important question to ask about any business, what are they producing or burning? Remember, the only reason a stock goes up (and stays up) is the result of growing revenue, earnings and cash flows. When looking at Global-E’s cashflow statement, the entire picture comes into light.
We realize that although they are not operating profitably, they are generating cash! I highlighted both operating cash flow and free cash flow. Operating cash flow is how much the cash the business is producing/burning just to operate. Free cash flow is how much the business still has after it pays off debts, taxes, etc. Free cash flow is, in many cases, more important than operating cash flow. This all tells us how efficiently the business model is operating and how well management is growing their business.
In 10 out of 10 situations, the business with a strong cash flow will out perform a business with a weak cash flow despite growth or growth story. The stock price will be less volatile and will not decline near as much as a money losing company.
Global-E Income Statement and Cash Flow Statement

When comparing the cash flow statement and income statement, I need to bring up this fundamental importance when selecting potential investments, especially when they are growth businesses. Many investors make the mistake of dismissing that a growth stock may be a poor investment because their GAAP profitability may be negative but this is not always relevant. In many cases, a growth business will reduce its bottom line “operating income” to a zero or slight below zero. The reason they do this usually has to do with tax benefits and investing back in the businesses human capital through stock based compensation. DataDog provides a perfect example of this.
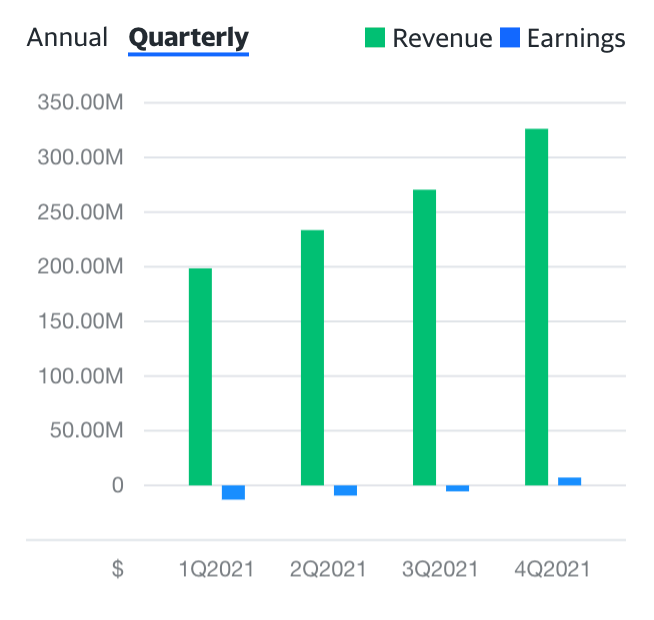
DataDog Quarterly Revenue/Earnings History: Notice how the blue bar is slightly below zero on consecutive quarters.
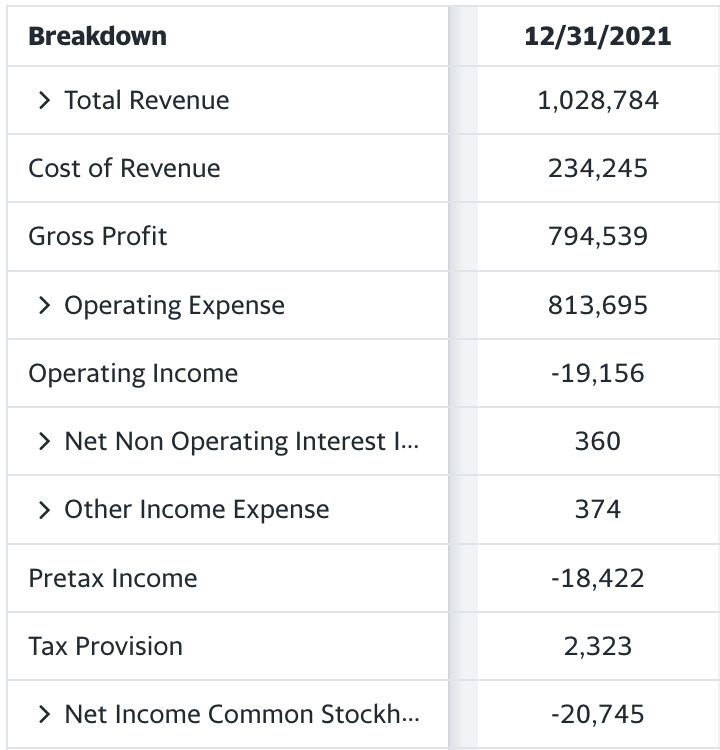
DataDog Full Year Income Statement: Notice how “operating income” is negative as well as “pretax income”
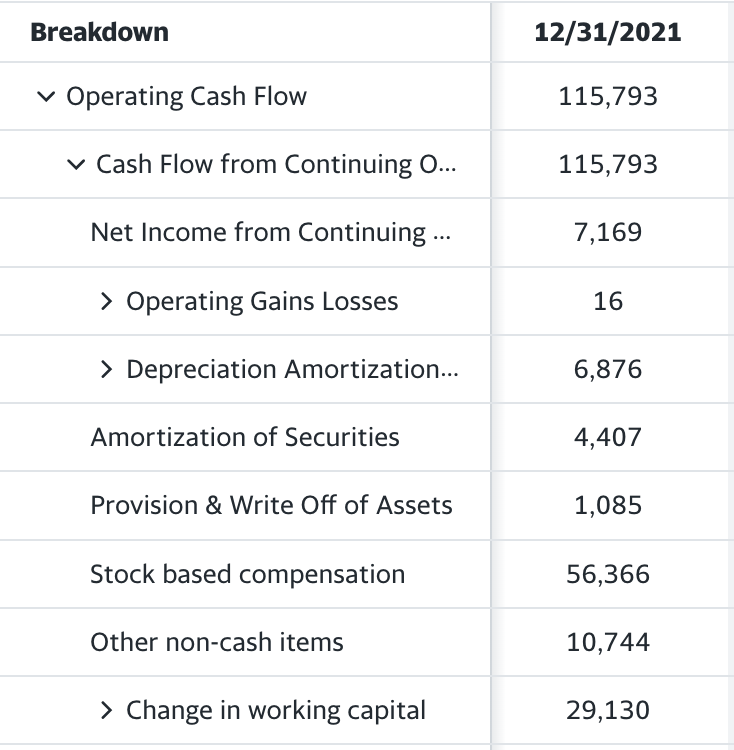
DataDog Past 3 Quarters on the Cash Flow Statement: Notice how they’ve been improving their operating and free cash flow for three consecutive quarters. They are operating profitably but not on a GAAP basis.

DataDog Operating Cashflow Broken Down: Notice “stock based compensation” at $56.3m. If they reduced this one line item, they’d be operating GAAP profitably. The tax code incentivizes businesses to record a GAAP loss. Many businesses will use Stock Based Compensation as an incentive to their employees to increase their income. Essentially, it’s a way to to pay less in salary to invest into other areas of the business.
DataDog is a very profitable business, they are generating large amounts of cash. A few other businesses that do this will be ZScaler, CrowdStrike, and Snowflake. Many of the biggest tech stocks on the market will do this as they continue to invest for growth but still produce healthy cash margins. Investors should be focused on these cash flow margins, not always GAAP profitability, and if growth is your focus as an investor then at least find businesses that generate meaningful cash flow from operations and free cash flow. Global-E has positive cash flow and 90%+ revenue growth.
Bringing the Financial Statements to Life
Let’s come back to GLBE, I posted this above, this is what we know about their business:
We know that they enable cross boarder e-commerce after looking at their website
Our market analysis led us to believe that this market (international e-commerce) is going to keep expanding for years and years into the future
We know competition is relatively low on a direct basis but on an indirect basis, there’s some competitive risk
After looking at the income statement, we know they are not operating profitably on a GAAP (Generally Accepted Accounting Principles) basis
We know that they have a healthy balance sheet with low/no debt and a solid cash balance
Now, we know they are operating profitably on a cash flow basis. This is important as it shows that the business is scaling for growth while managing its business operations and cash position appropriately. Knowing the details of the financial statements validates us to accept the risk that comes with any company. At the very minimum, we have the confidence in knowing that the business wont go out out of business because they are capable of operating profitably with their existing model. Over time, as investors, we will constantly be seeking to see improvements in the bottom line metrics and consistently in revenue growth. The reason why we do this….
The only reason a stock goes up, it generates more revenue, earnings and cash flow’s over time. Nothing else matters, this is the only reason a stock goes up and stays up over time. The fluctuation in the stock price is only the result of a “perceived” future return on capital that varies with recession risks, interest rate adjustments and sentiment on the future of the business.
Valuing a Business - A Difficult but Necessary Task
Valuing a business is difficult, especially in the growth market. Traditionally, PE was king, specifically trailing twelve month (TTM) PE. This is a metric that holds true even in a Bear Market. It’s a metric that was foundational in Benjamin Graham’s (author of “The Intelligent Investor”) thesis when value investing was born. However, market cycles are real (meaning this metric wont always work) and some of the largest gainers in history have been growth stocks. Investing in some of these growth stocks (at a good price) have produced life changing returns for tens of millions, maybe even hundreds of millions of investors all around the world.
The PE Ratio is essentially the price to earnings ratio (Market Cap / Earnings = PE). You are paying a price for a certain amount of earnings. If you pay 10x P/E, you can expect to get your initial investment back within 10 years (assuming no growth in the business) in the form of earnings.
P/E and forward P/E is relatively straight forward. When first looking at a more mature company, using the TTM (trailing twelve months) P/E may be the way to go especially if they have little to no growth. However, if a business is growing profitably it more feasible to use a forward P/E metric. The forward P/E is essentially the predicted earnings in the NTM (next twelve months). If a business is growing, a good rule of thumb for value investing could be:
10% YoY business growth trading less than a forward P/E of 20
20% YoY business growth trading less than a forward P/E of 25
30% YoY business growth trading less than a forward P/E of 30
Where it begins getting complicated is when a business is growing extremely fast. Investors need to know that the earnings are being pulled out from the future and that is what the business would otherwise be valued on.
The best way to think about this is that, for many stocks, they are priced out 5 - 10 years in the future. This means that both value companies and growth companies, their real P/E is being measured 5 years in the future. If a value company is growing at 10% a year and the projected 5 year P/E is going to be 10x, then a growth company would also have a forward P/E of 10x 5 years into the future. However, the market often discounts this based on growth projections, the size of the business and estimates cost of future cash flows based on interest rates, etc. Yes, this is complicated and it’s a lot. There is another way to make this more simple.
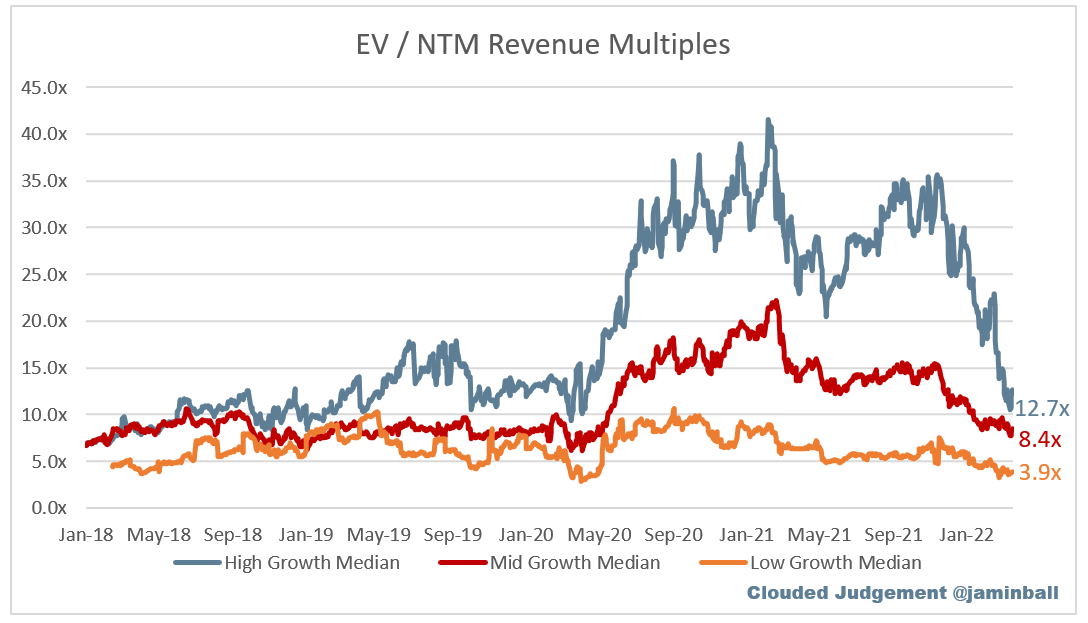
Growth stocks, especially unprofitable hyper growth stocks are often trading on revenue multiples. I love this picture by @jaminball (Twitter name) as it clearly shows that high growth companies usually trade between 10x - 15x sales. As a rule of thumb for growth companies you can think of it like this:
High growth: 50%<
Medium growth: 30% - 50%
Low growth: <30%
When using price to sales (P/S) or enterprise value to sales (EV/S), it is helpful to know the difference between the two. The Market Cap of the company is considered the “price” or “valuation” of the business. The market cap is essentially (current share price) x (number of shares outstanding) = market cap. Basically, it’s the total value of the company if you were to buy it out today and this fluctuates daily based on the current trading value of the individual share price. Enterprise value is the price of the business when you factor in the cash and debt on the balance sheet. It essentially helps factor in risk. The equation to use there would be: (Market cap) - (cash - debt) = Enterprise Value.
When trying to find the numbers to all these metrics, it’s helpful to use a tool like Yahoo Finance who provides all these numbers for free. To find cash and debt, refer to the balance sheet like I mentioned above. In order to find the market cap, Yahoo Finance does a great job keeping this data up-to-date on their platform.
To keep things simple and to help me determine if a stock is over or under valued, I usually quickly look at their P/S ratio. This is a very fast metric investors can use to get an understanding where a lot of these companies are trading. I prefer other metrics to really dig in to understand the full story of the business. More on that a little later.
Let’s use a few examples of company price to sales valuations that I own:
DDOG: DataDog - Application monitoring & DevSecOps. SaaS business model.
Market Cap: $49B
2022 Expected Full Year Revenue: $1.5B
2022 Expected Growth: 50%
Fiscal Year 22 Price to Sales Ratio: 33x P/S
SNOW: Snowflake - Data and Analytics. Software consumption based business model.
Market Cap: $73B
2022 Expected Full Year Revenue: $2B
2022 Expected Growth: 67%
Fiscal Year 22 Price to Sales Ratio: 36.5x P/S
ZS: ZScaler - Pioneer of Zero trust, Security Infrastructure. SaaS business model.
Market Cap: $35B
2022 Expected Full Year Revenue: $1B
2022 Expected Growth: 55%
Fiscal Year 22 Price to Sales Ratio: 35x P/S
CFLT: Confluent - Enterprise Kafka management. SaaS business model.
Market Cap: $12B
2022 Expected Full Year Revenue: $550m
2022 Expected Growth: 41%
Fiscal Year 22 Price to Sales Ratio: 24x P/S
S: SentinelOne - EndPoint security and Data/Analytics. SaaS business model.
Market Cap: $11B
2022 Expected Full Year Revenue: $370m
2022 Expected Growth: 80%
Fiscal Year 22 Price to Sales Ratio: 30x P/S
DOCN: DigitalOcean - Cloud infrastructure. Software consumption business model.
Market Cap: $6.7B
2022 Expected Full Year Revenue: $570m
2022 Expected Growth: 32%
Fiscal Year 22 Price to Sales Ratio: 12x P/S
GLBE: Global-E - International e-commerce management platform. SaaS and service business model.
Market Cap: $5B
2022 Expected Full Year Revenue: $420m
2022 Expected Growth: 70%
Fiscal Year 22 Price to Sales Ratio: 12x P/S
DLO: DLocal - Payment infrastructure API. Consumption based business model.
Market Cap: $9.7B
2022 Expected Full Year Revenue: $410m
2022 Expected Growth: 70%
Fiscal Year 22 Price to Sales Ratio: 24x P/S
UPST: Upstart - Artificial intelligence loan origination platform. Origination business model.
Market Cap: $10B
2022 Expected Full Year Revenue: $1.45B
2022 Expected Growth: 67%
Fiscal Year 22 Price to Sales Ratio: 7x P/S
PLTR: Palantir - Data, analytics, security, monitoring and visualization. SaaS based business model.
Market Cap: $29B
2022 Expected Full Year Revenue: $2B
2022 Expected Growth: 30%
Fiscal Year 22 Price to Sales Ratio: 15x P/S
*All metrics pulled from Seeking Alpha*
There are a few points that I want to make here in regards to the valuations above. Most investors stop here at P/S and see certain businesses trading at high price to sales ratios, or even low P/S ratios and quickly determine if a business is over or under valued. For example, Upstart is growing extremely quick but their P/S ratio is 7x! But, in comparison, DataDog is trading at 33x P/S. Why would this happen? In addition, if we compare Global-E to DLocal, their P/S ratios are 12x and 24x respectively but they are both expected to do roughly $400m in sales this year. Why are they valued different?
Growth Business Bottom Line MATTERS
Let me show you a few pictures from an app I use: Simply Wall Street.
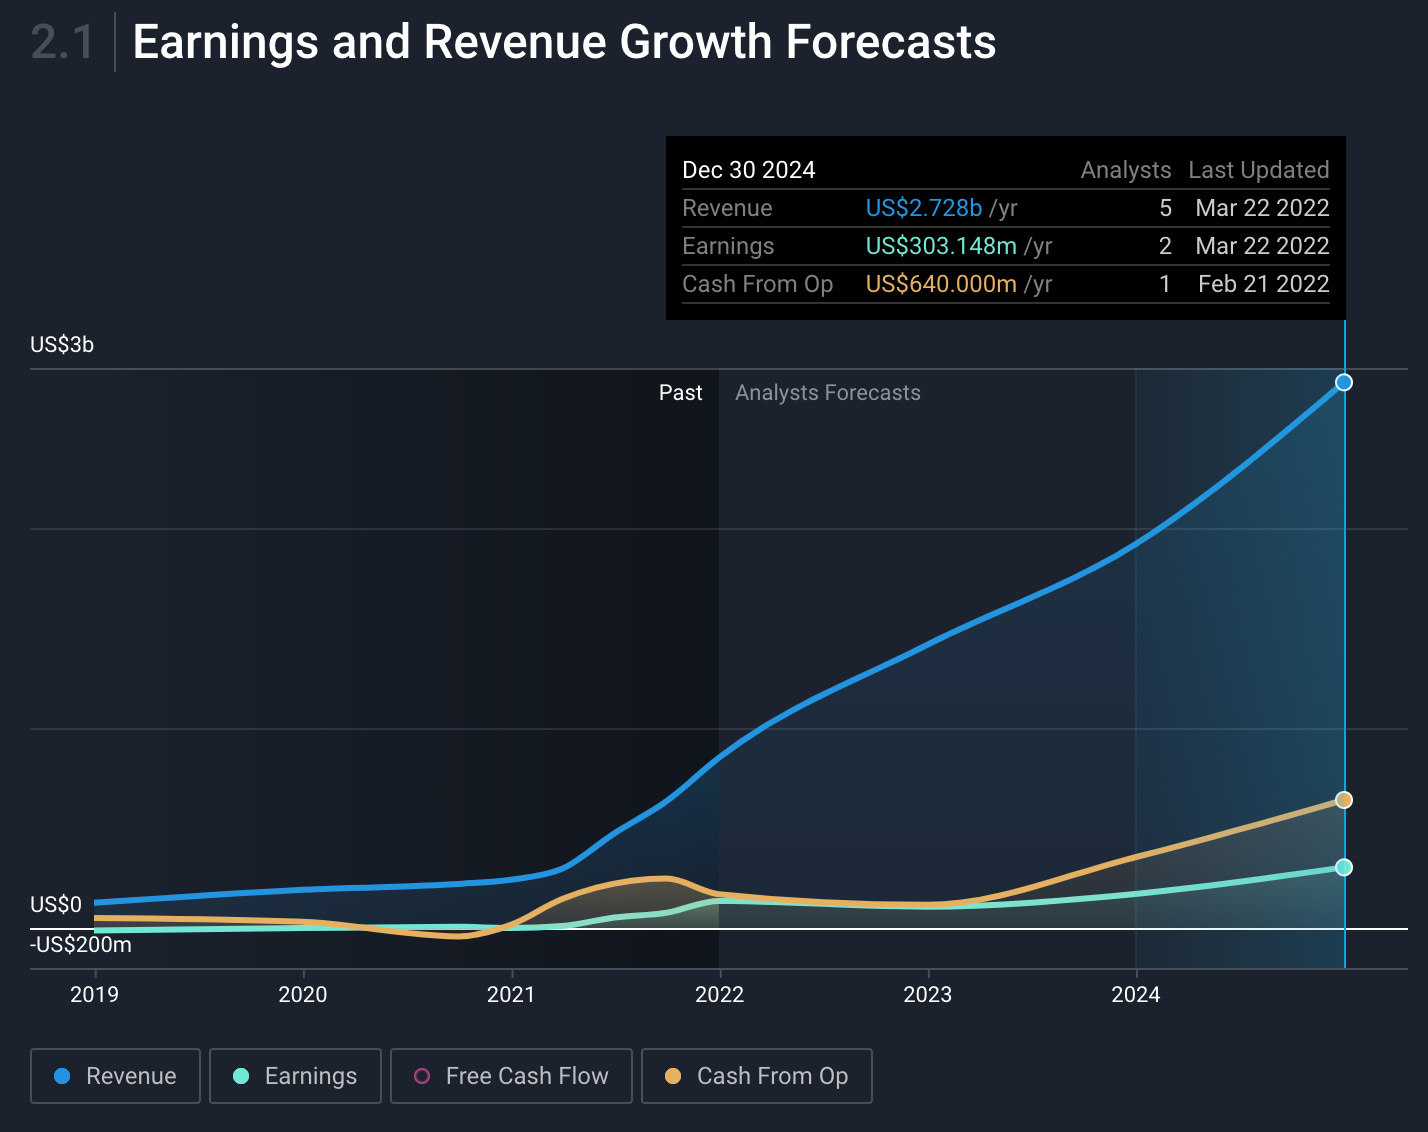
DLocal Projected Revenue and Earnings Growth: Notice revenue and earnings growth

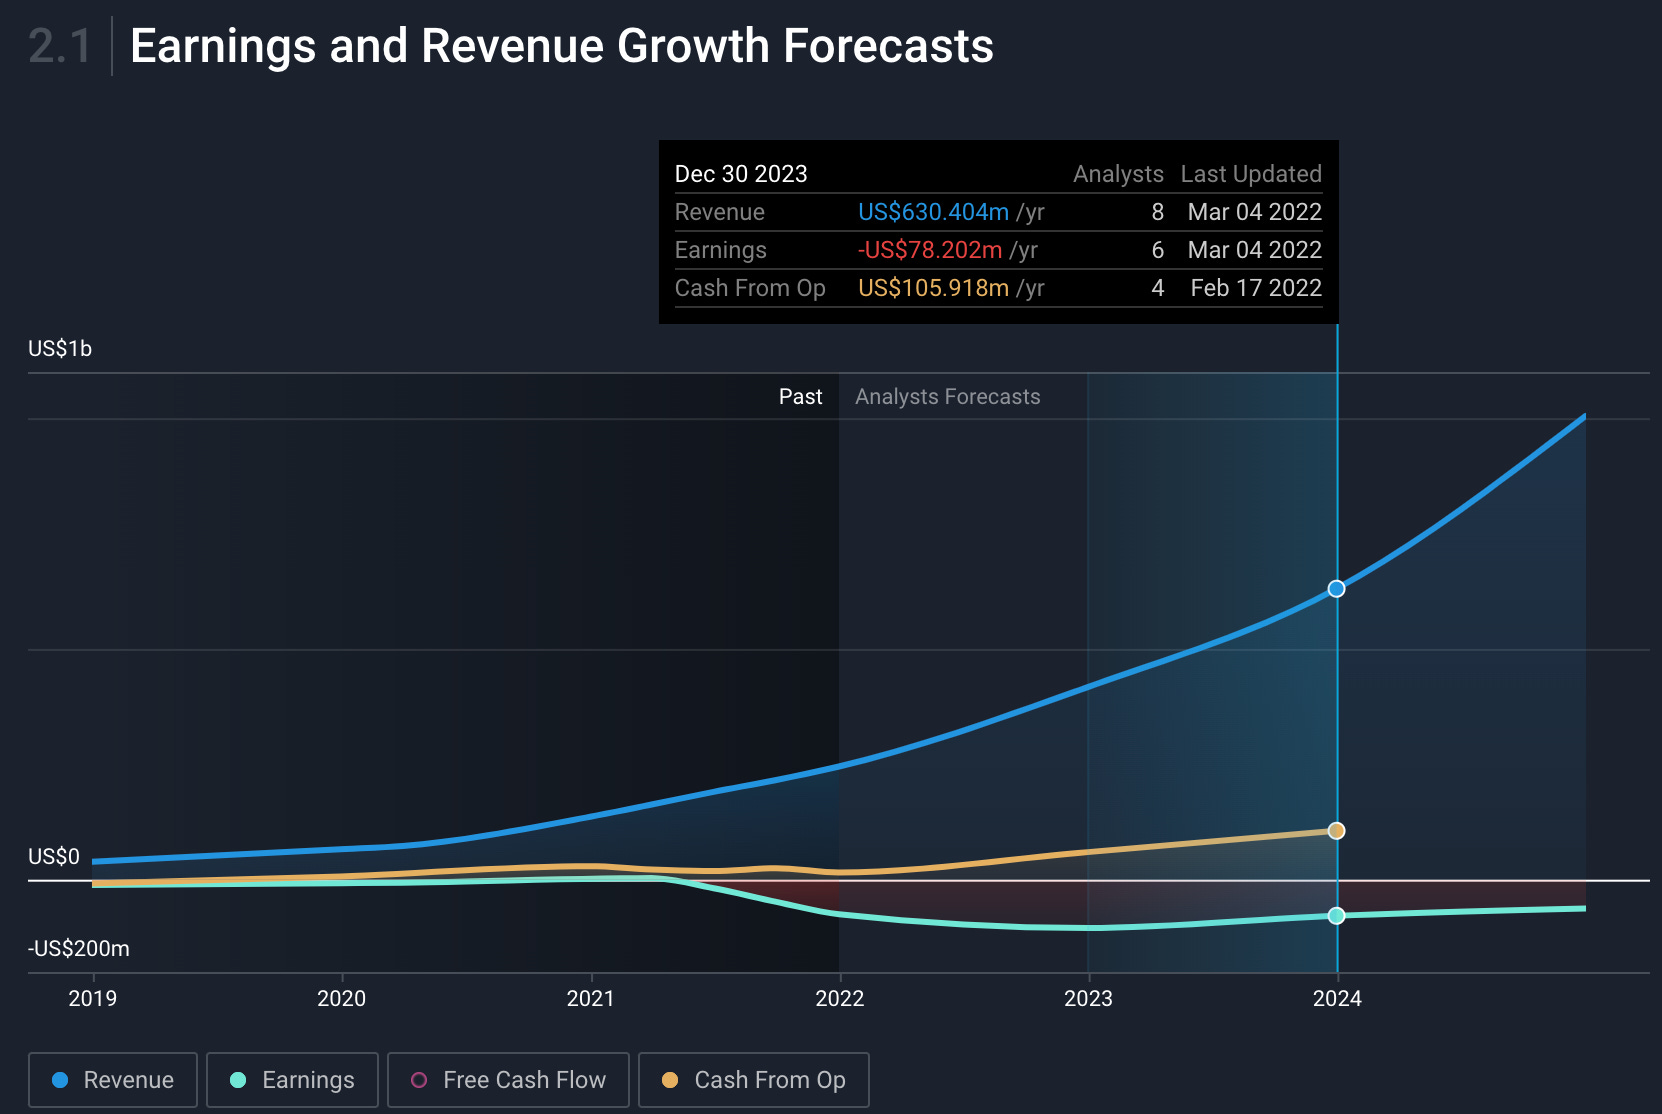
Global-E Projected Revenue and Earnings Growth: Notice operating cash flow and GAAP earnings
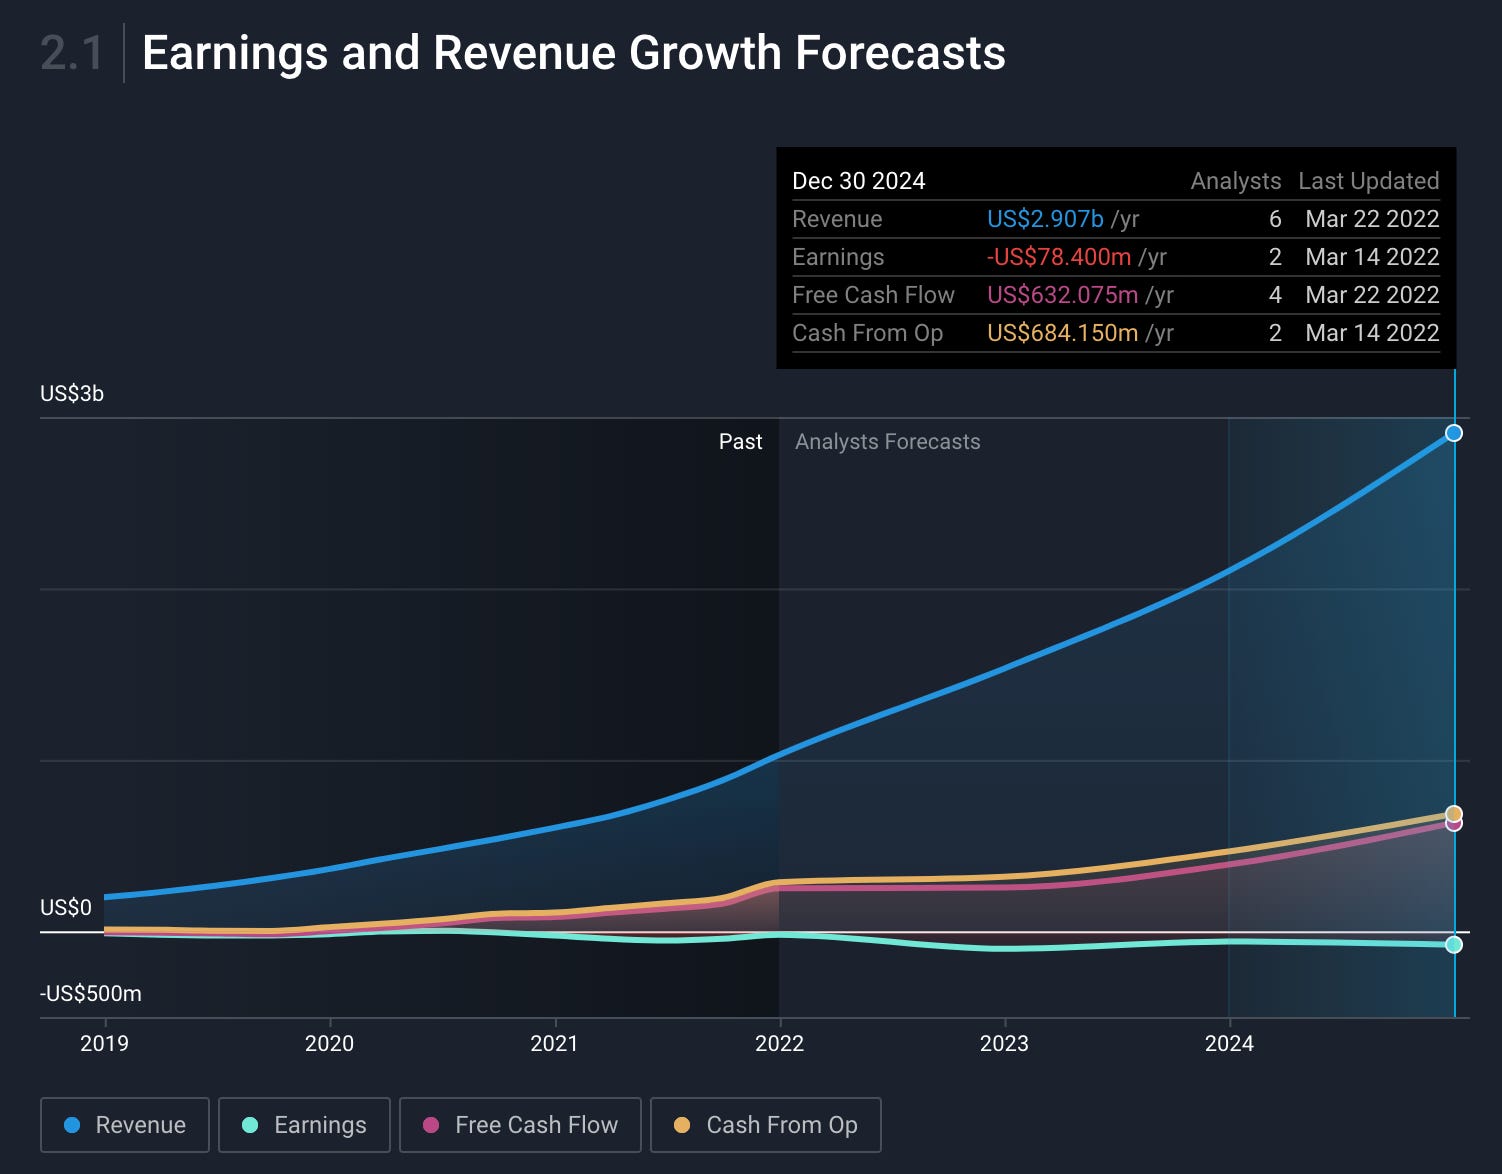
DataDog Projected Revenue and Earnings Growth: Notice cash flow from operations and free cash flow.
Upstart Revenue and Earnings Growth: Notice revenue, earnings and cash flow from operations.
When you look at all these businesses you will notice that the bottom line metrics vary from business to business. Remember what I mentioned above? Stocks ONLY go up and stay up because revenue, earnings and cash flows go up over time. If a business, like Global-E, does not produce as much earnings as another, DLocal, you quickly notice the disparity in valuation.
When comparing Upstart and DataDog the understanding is in the details. Let me first say, not all revenue and earnings are made the same. Certain revenue is more risky than other business models. DataDog in this case is a SaaS (software as a service) based model which means that a majority of their revenues is in the form of a subscription. It’s predictable, it’s safe, and it’s a mission critical application in another business. UpStart is NOT predictable and is subject to variabilities in the credit markets and investor appetite. When reviewing Upstart’s business model we know that they yield revenue from loans that they originate and sell to investors on Wall Street. Questions immediately come up like, “what happens if the credit markets tank?”, or, “what happens if investors don’t want Upstart loans anymore?” These unanswered questions make Upstart more risky, thus, justifying a lower valuation.
Valuation can be thought of as a spectrum in the sense that risk, earnings and quality of revenue all play an interchangeable role. Remember, in the beginning of this publication I said that that we are in a “market” to buy and sell business equity. This means that a stocks price is only what another investor is willing to pay. This price moves based on perceived risk, revenue, earnings and cash flows but it only goes up as the business consistently improves revenue, earnings and cash flows.
Enterprise Value to EBITDA, Gross Profit and Free Cash Flow
Recall when I mentioned that using price to sales (P/S) is a “quick”way to measure a company to see if it’s over valued or not. A significantly more durable way to quantify the value of the business is by benchmarking its price to bottom line metrics from historical measures. In more simple terms, a few key metrics you can use are:
Enterprise value to EBITDA: EV/EBITDA
Enterprise value to gross profit: EV/GP
Enterprise value to free cash flow: EV/FCF
Some may be aware of what EBITDA is but let me briefly touch up on exactly what it means and what it measures. EBITDA is other wise known as Earnings Before Interest, Taxes, Depreciation & Amortization. This is a way to measure business profitability before variable metrics and taxes. To break this down further:
Interest is otherwise known as the interest a business may pay on debt it owes
Taxes are known as the taxes the business pays to the government to operate
Depreciation and Amortization is the writing off of an asset (both tangible and intangible), or, making it cheaper to account for the devaluation of the asset over time. Think of a vehicle and how that depreciates over time. Businesses can write this depreciation off as an expense to make it look like they are making less money.
Many of these costs don’t necessarily reflect exactly how profitable the business may operate. In addition, many businesses use “adjusted EBITDA” which basically means they are factoring in stock based compensation and potentially a few other metrics. In both cases, if said simply, we can conclude that EBITDA is a way to measure the businesses “ability” to be profitable.
Gross profit is relatively straight forward in the sense that it’s the fixed cost to sell a product. For example, if you want to sell shoes at a shoe store, the gross profit would be how much profit you keep after selling the shoe. However, it costs you money to buy or manufacture that shoe in the first place. It could be broken down like this:
You are looking to sell Nike shoes for $60. However, you purchased it from a wholesale vendor for $30. You mark the price up to $60 so you can realize 50% gross profit.
In many cases, valuing young hyper growth companies on gross profit is useful because it accurately reflects how profitable the business can be over time. Investors are significantly more likely to justify a higher valuation for a company with 70% gross profit margins compared to a company with 20%. Many SaaS businesses have 70%+ gross profit margins which is why you typically see them trading at higher P/S multiples than retailers who usually have 20% gross profit margins.
Free cash flow is representative of the businesses overall cash inflows or outflows. Operating cashflow is just the cash generated from operations but free cash flow may be allocated toward investments, paying down debt, buying back stock, etc. Basically, positive free cash flow is an excellent metric to have in any investment. It means that management is operating the business efficiently.
When using any one of these metrics to value a business, it helps investors accurately value a business. A good rule of thumb is: “the further you go down the income statement to value a business, the better.” Businesses valued on GAAP earnings are significantly less volatile that a business solely valued on sales. If we ranked the reliability (and volatility) of commonly used valuation metrics we could rank them:
Price to sales (least reliable and most volatile): P/S
Enterprise value to gross profit: EV/GP
Enterprise value to EBITDA: EV/EBITDA
Enterprise value to free cash flow: EV/FCF
Forward price to earnings: NTM P/E
Price to earnings: TTM P/E
Despite what some investors may say, valuation matters, especially over time. It matters what price you pay, as an investor, as well. When volatility gives you opportunities to buy some of these game changing, growing businesses, it is wise of the investor to purchase them at a steep discount. Many of the businesses listed above work on secular trends rather than cyclical trends. This means that if you have the chance to buy high conviction stocks (based on your thesis of the business model and the financial statements that validated the thesis) at cheaper prices, we can use volatility to enhance our future returns.
Conclusion
This is the longest SubStack I have ever done but I knew I wanted to do it for all of you, the readers and listeners. As mentioned before, I want to help and SubStack is often my way of vocalizing all the information I have to give to all who want to listen and learn. For those of you who read this all the way through, thank you. But not necessarily thank you for reading my material, thank you for taking the time to invest into your financial future.
They often say that the first and most important investment we make is into ourselves and into our knowledge. In this case, I know I sound like a broken record but I have to say it one more time. Stocks only go up and stay up for one reason, because a business successfully grows revenues, earnings and cashflows over time.
Stay Tuned, Stay Classy
Dillon


Stock Picking the Best Companies